Open Access
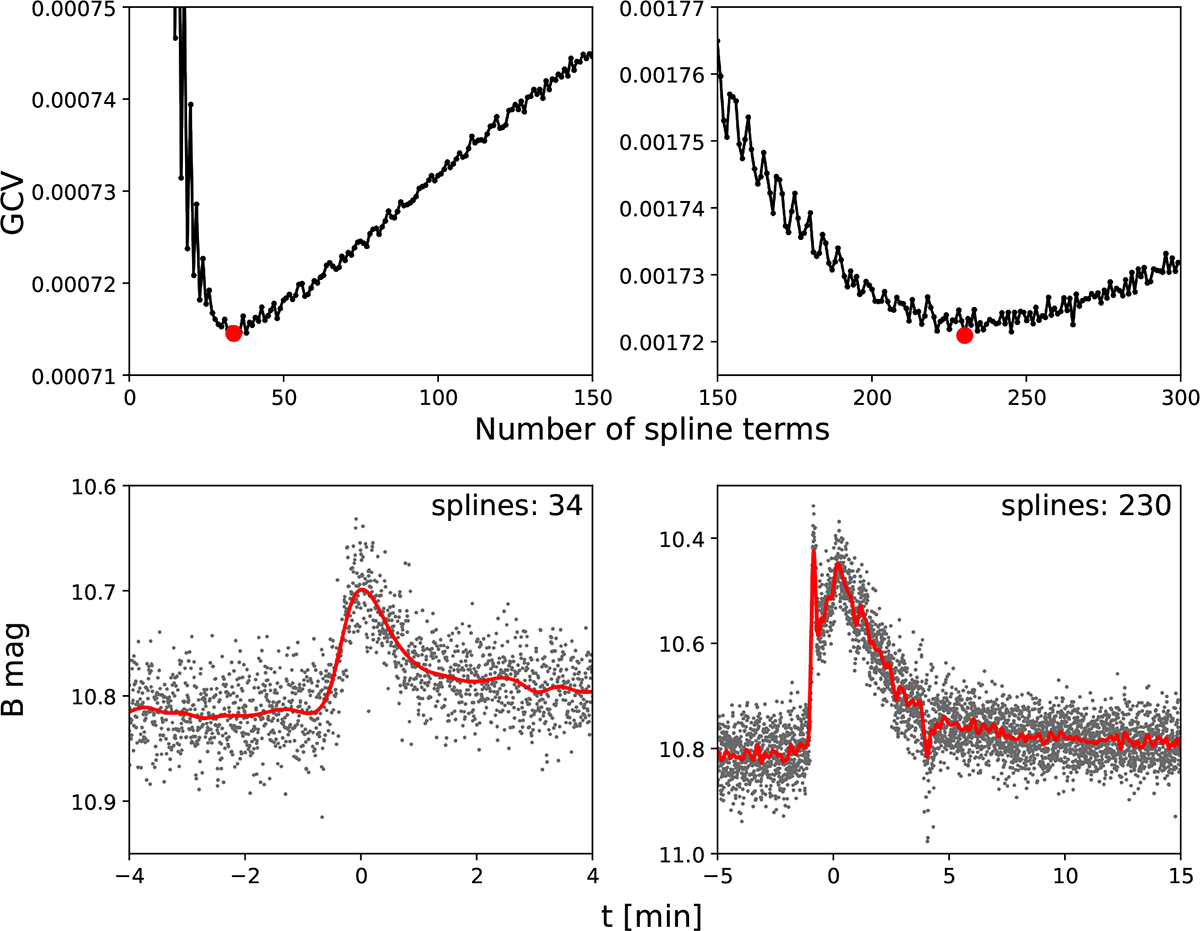
Fig. 1.
Download original image
Complexity assessment with GAMs for two flares. Top: GCV score as a function of the number of spline terms, with the red point marking the minimum. Bottom: Flares with the best-fitting curve corresponding to this minimum; associated spline values are indicated in the panels.
Current usage metrics show cumulative count of Article Views (full-text article views including HTML views, PDF and ePub downloads, according to the available data) and Abstracts Views on Vision4Press platform.
Data correspond to usage on the plateform after 2015. The current usage metrics is available 48-96 hours after online publication and is updated daily on week days.
Initial download of the metrics may take a while.