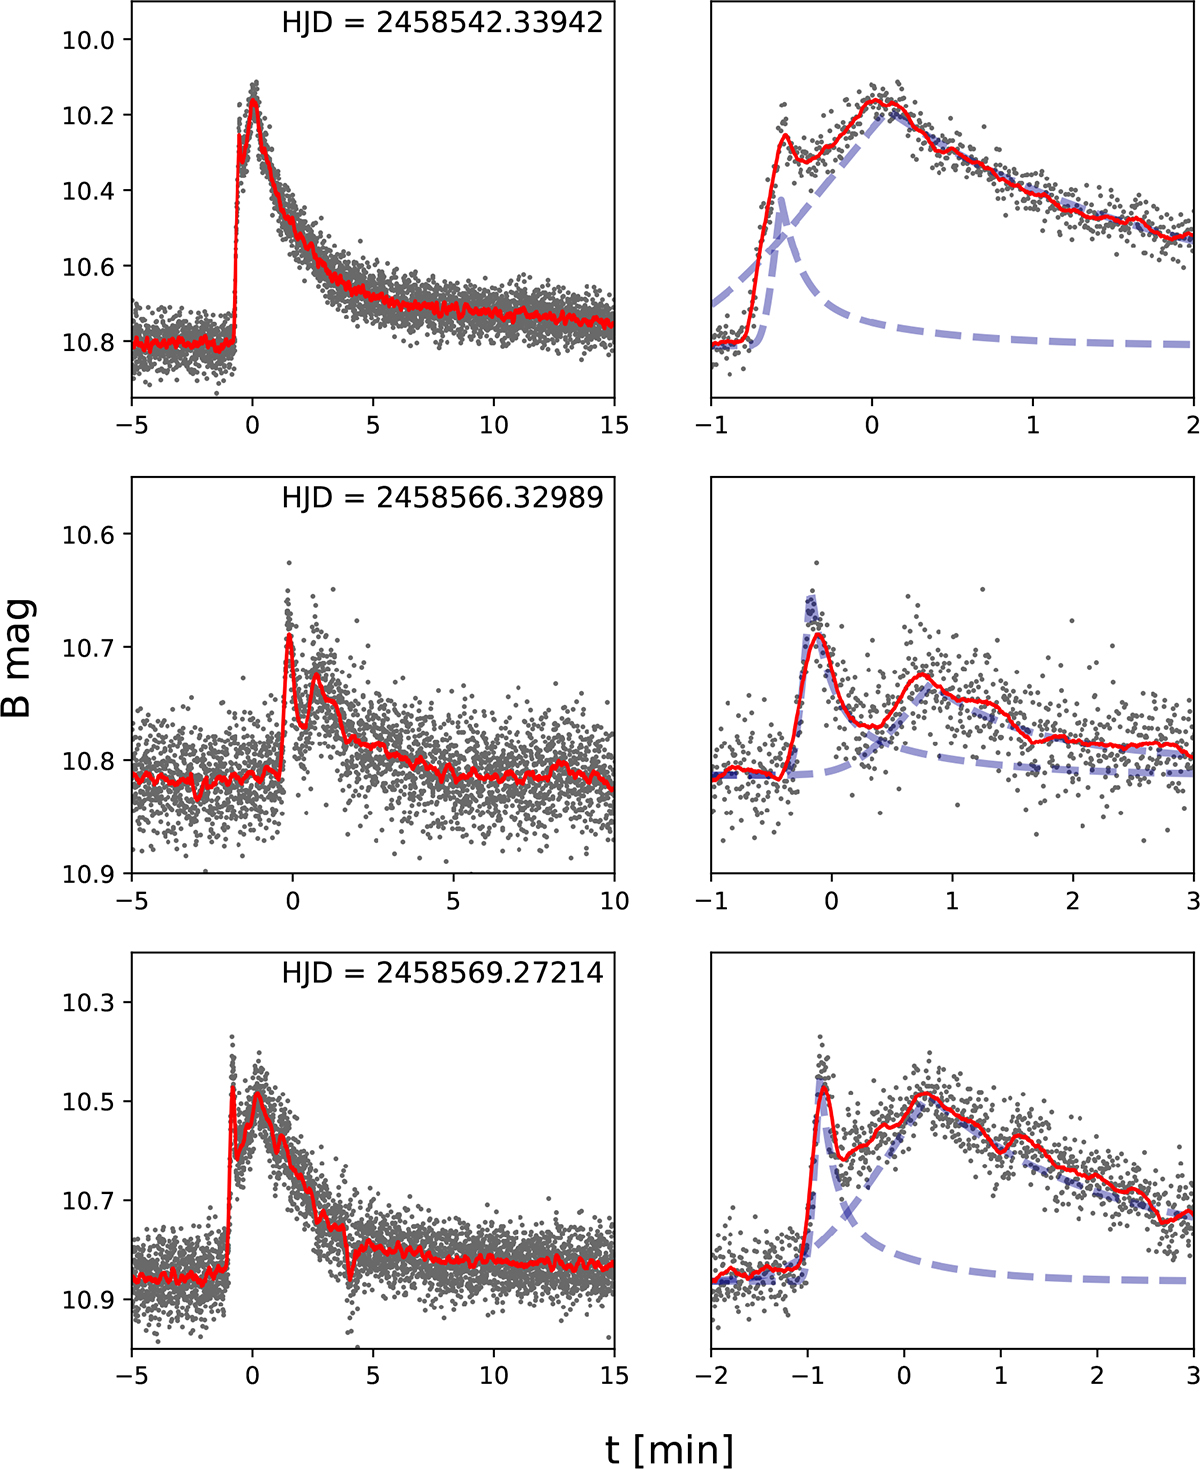
Fig. 3.
Download original image
Light curves of flares exhibiting complex temporal structures are shown as gray points, with the corresponding smoothed curves indicated by red lines. The first column shows the full flare profiles, while the second column provides magnified views of the peaks, illustrating the two fitted flare components with dashed lines. The HJD indicated in each panel of the first column corresponds to t = 0 on the time axis.
Current usage metrics show cumulative count of Article Views (full-text article views including HTML views, PDF and ePub downloads, according to the available data) and Abstracts Views on Vision4Press platform.
Data correspond to usage on the plateform after 2015. The current usage metrics is available 48-96 hours after online publication and is updated daily on week days.
Initial download of the metrics may take a while.