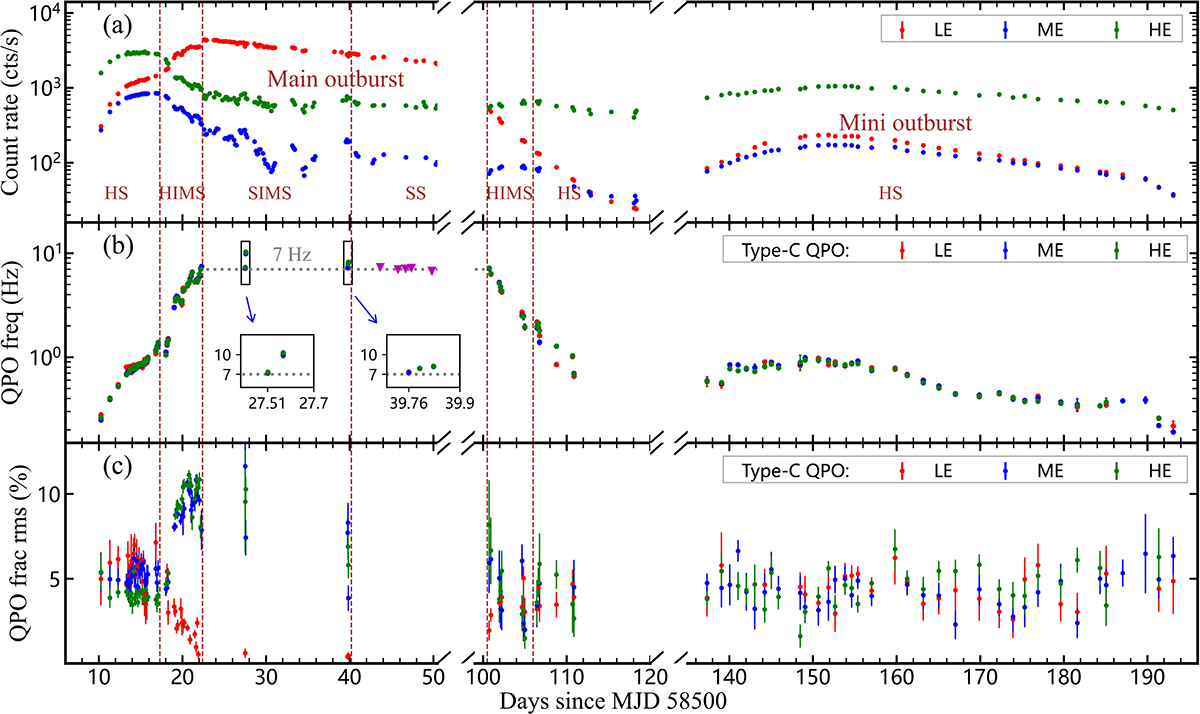
Fig. 1.
Download original image
Evolution of the count rate (a), the centroid frequency (b), and the fractional rms (c) of the type-C QPOs as observed with the three Insight-HXMT instruments. For comparison, the frequencies of type-A QPOs reported by Zhang et al. (2023) are also plotted in panel (b) (magenta triangles). Vertical dashed brown lines demarcate the different states during the main and mini-outbursts.
Current usage metrics show cumulative count of Article Views (full-text article views including HTML views, PDF and ePub downloads, according to the available data) and Abstracts Views on Vision4Press platform.
Data correspond to usage on the plateform after 2015. The current usage metrics is available 48-96 hours after online publication and is updated daily on week days.
Initial download of the metrics may take a while.