Fig. 15
Download original image
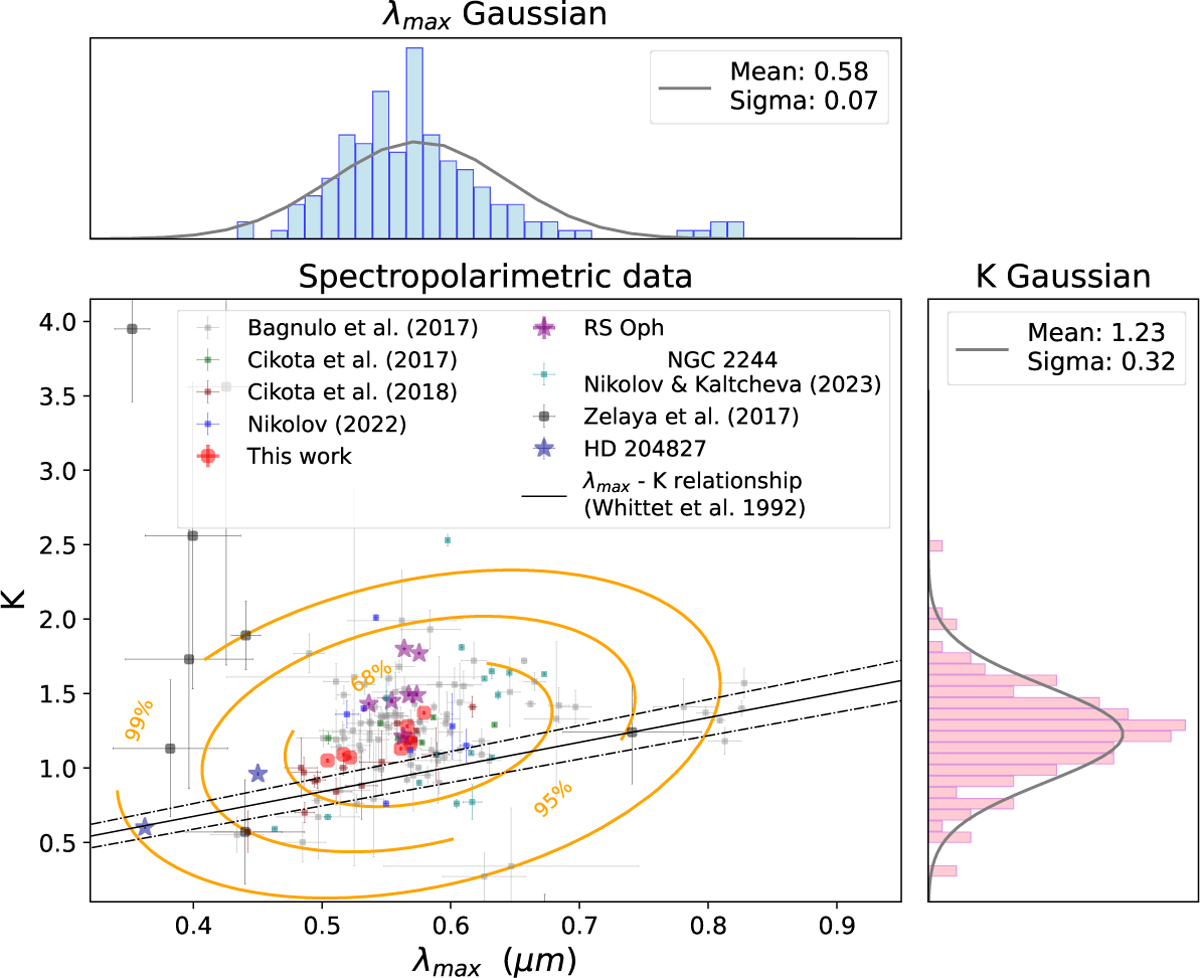
K and λmax plane. The figure containing our eight unvariable standard stars compared to the sample from Bagnulo et al. (2017); Cikota et al. (2018, 2017); Nikolov (2022); Zelaya et al. (2017); Nikolov & Kaltcheva (2023). The empirical K-λmax relation determined by Whittet et al. (1992) is presented with a black line and the dashed black lines trace the 1σ uncertainty.
Current usage metrics show cumulative count of Article Views (full-text article views including HTML views, PDF and ePub downloads, according to the available data) and Abstracts Views on Vision4Press platform.
Data correspond to usage on the plateform after 2015. The current usage metrics is available 48-96 hours after online publication and is updated daily on week days.
Initial download of the metrics may take a while.