Fig. 17
Download original image
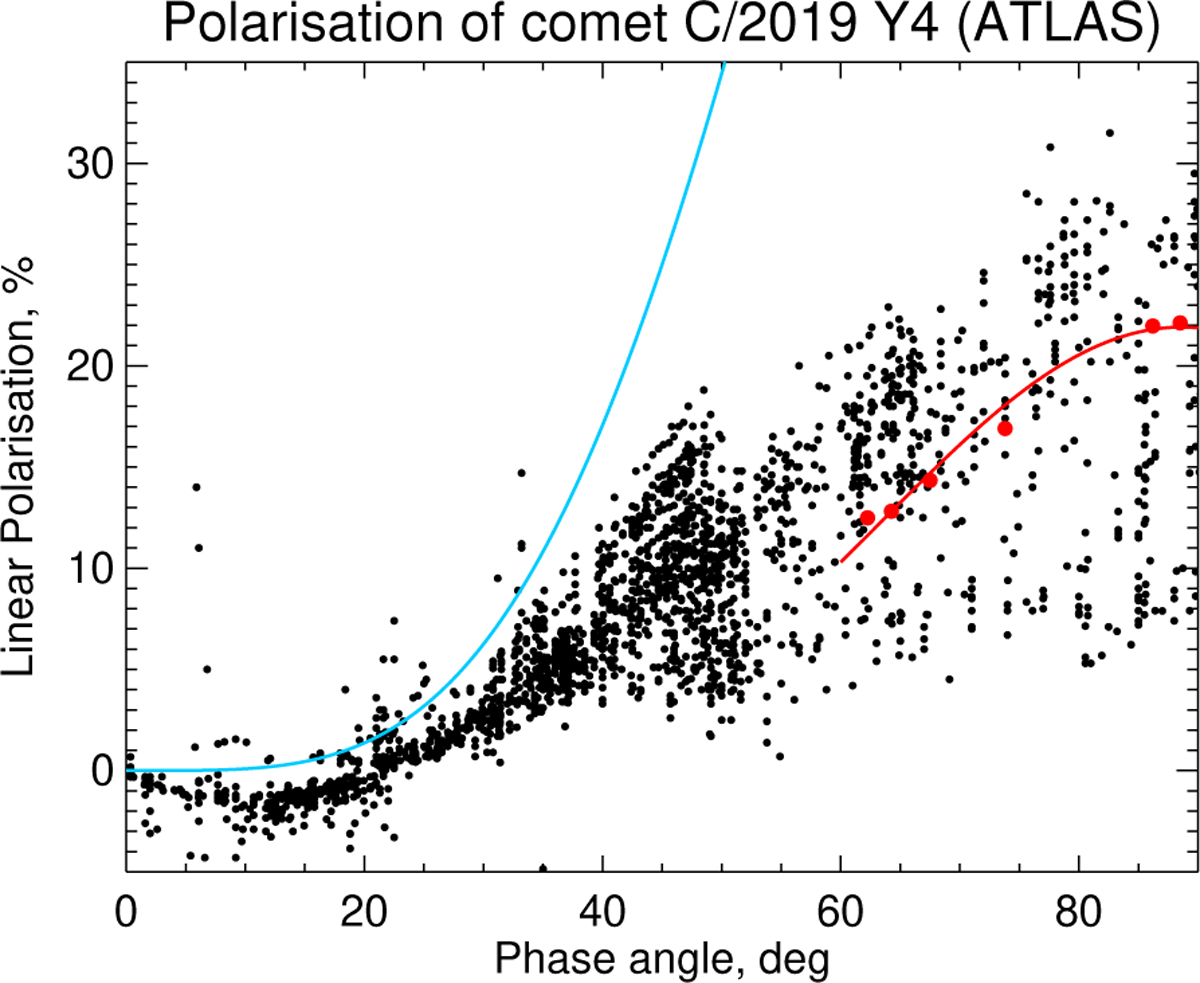
Polarisation phase curve of the comet C/2019 Y4 (ATLAS). Red points are our observations and the red line is their fit with the function from Eq. (11). The blue line represents the Rayleigh scattering from a single particle with LPmax=100% at a phase angle of 90°. Black points are measurements from the comets polarimetry database by Kiselev et al. (2010).
Current usage metrics show cumulative count of Article Views (full-text article views including HTML views, PDF and ePub downloads, according to the available data) and Abstracts Views on Vision4Press platform.
Data correspond to usage on the plateform after 2015. The current usage metrics is available 48-96 hours after online publication and is updated daily on week days.
Initial download of the metrics may take a while.