Fig. 1.
Download original image
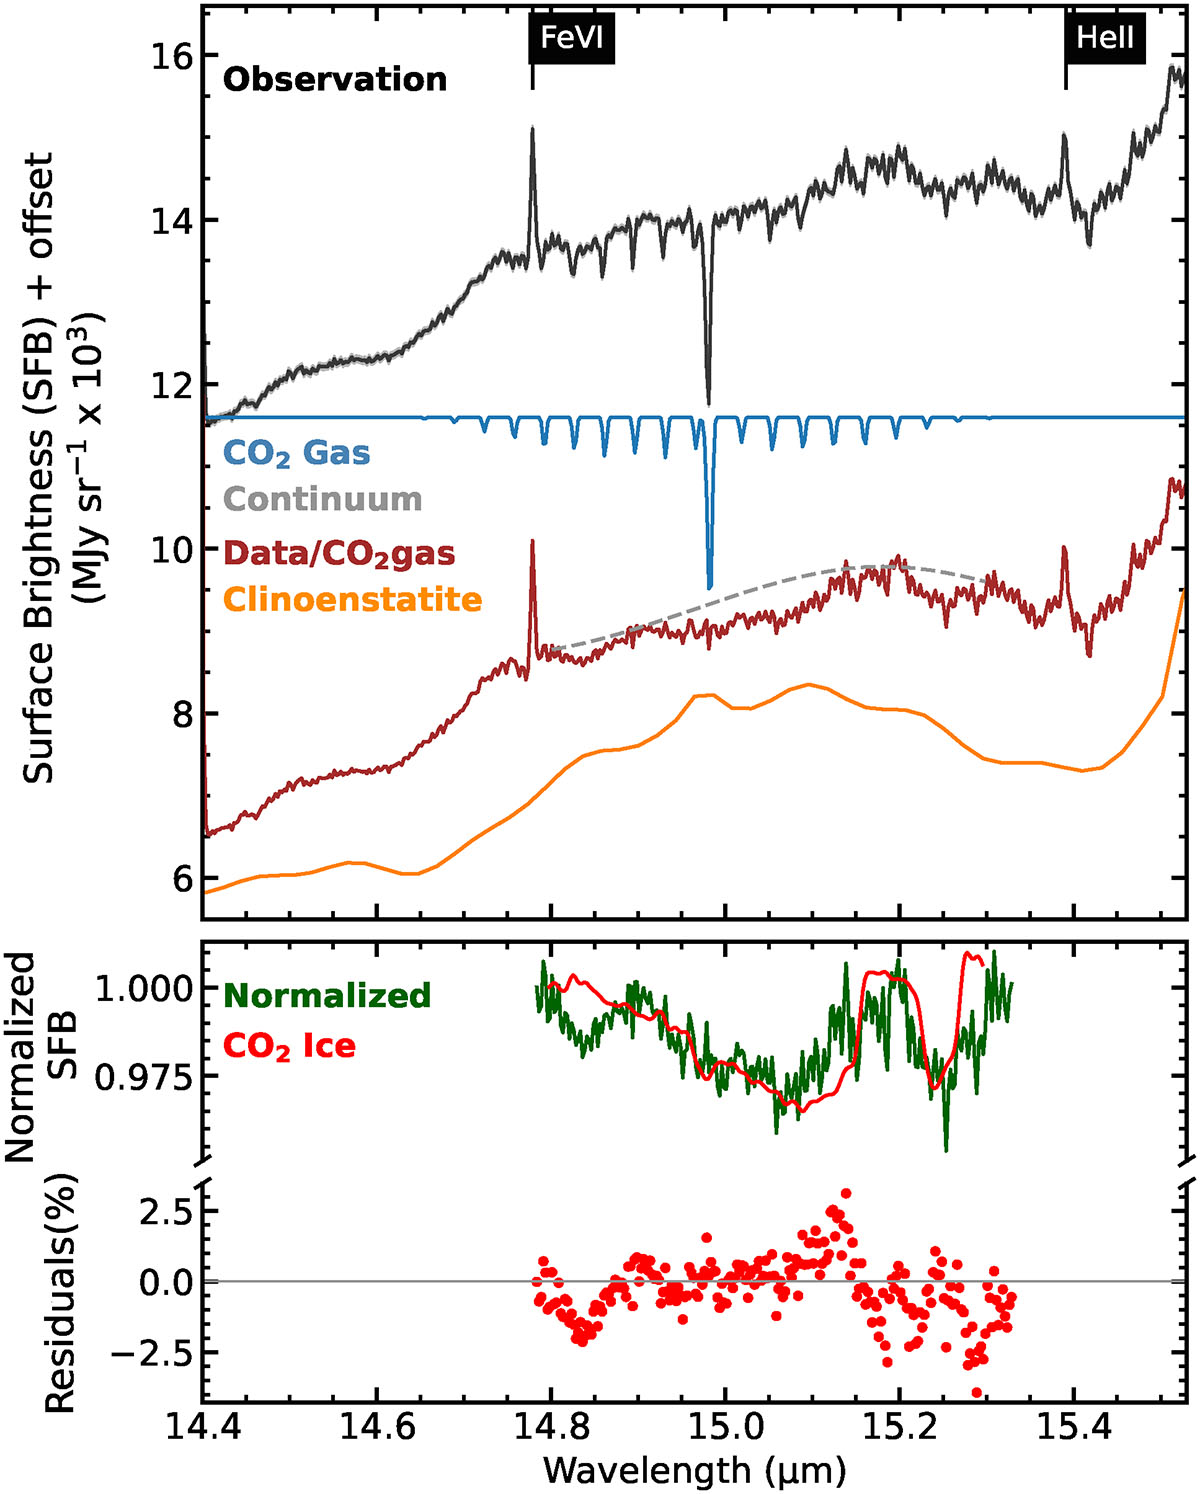
Detection of CO2 ice and gas. The overplotted black curve shows the JWST/MIRI spectrum at the position indicated by the dot in Fig. A.1. The uncertainties on the surface brightness are ∼ ± 40 MJy sr−1. The best-fit gas-phase model (Tgas = 30 K and log N = 16.8 cm−2) is shown in blue. We divided out this model, resulting in the brown curve. The orange curve shows a single-temperature model for clinoenstatite emission. The dashed gray line shows the continuum we adopted to analyze the ice band. The green curve shows the normalized spectrum using that continuum. The red curve shows a laboratory spectrum for CO2 ice (CO:CO2 2:1 ice mixture at 80 K); and the bottom panel shows the residuals between the normalized spectrum (green) and the ice model (red).
Current usage metrics show cumulative count of Article Views (full-text article views including HTML views, PDF and ePub downloads, according to the available data) and Abstracts Views on Vision4Press platform.
Data correspond to usage on the plateform after 2015. The current usage metrics is available 48-96 hours after online publication and is updated daily on week days.
Initial download of the metrics may take a while.