Fig. 2.
Download original image
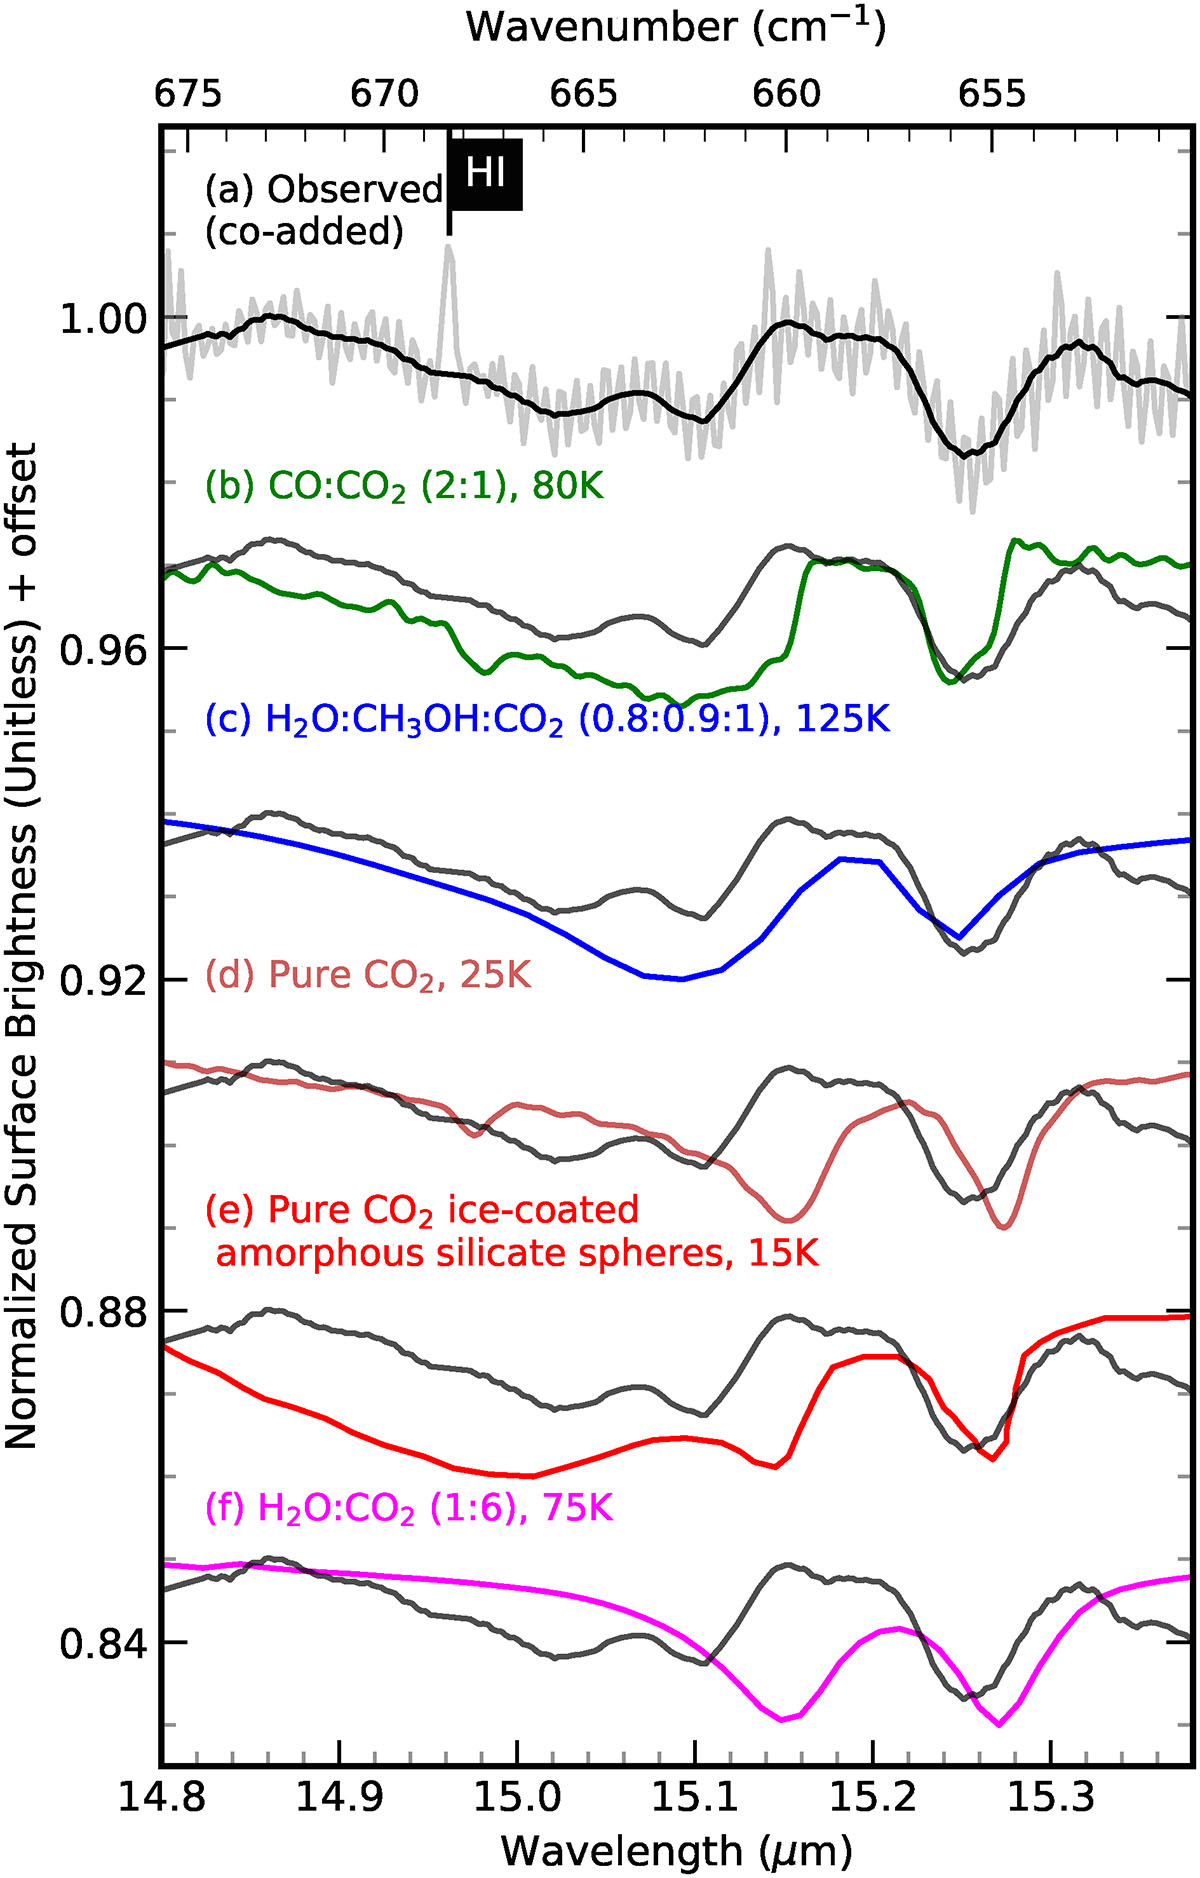
Comparison of observational and laboratory ice spectra. (a) Co-added CO2 absorption profile across all pixels with detectable CO2 (gray), with the smoothed profile after masking the H I line at 14.96 μm overplotted in black. Laboratory spectra: (b) CO:CO2 (2:1) at 80 K (green); (c) H2O:CH3OH:CO2 (0.8:0.9:1) at 125 K (blue); (d) pure CO2 at 25 K (brown); (e) pure CO2 on amorphous silicate spheres at 15 K (red); (f) H2O:CO2 (1:6) at 75 K (pink).
Current usage metrics show cumulative count of Article Views (full-text article views including HTML views, PDF and ePub downloads, according to the available data) and Abstracts Views on Vision4Press platform.
Data correspond to usage on the plateform after 2015. The current usage metrics is available 48-96 hours after online publication and is updated daily on week days.
Initial download of the metrics may take a while.