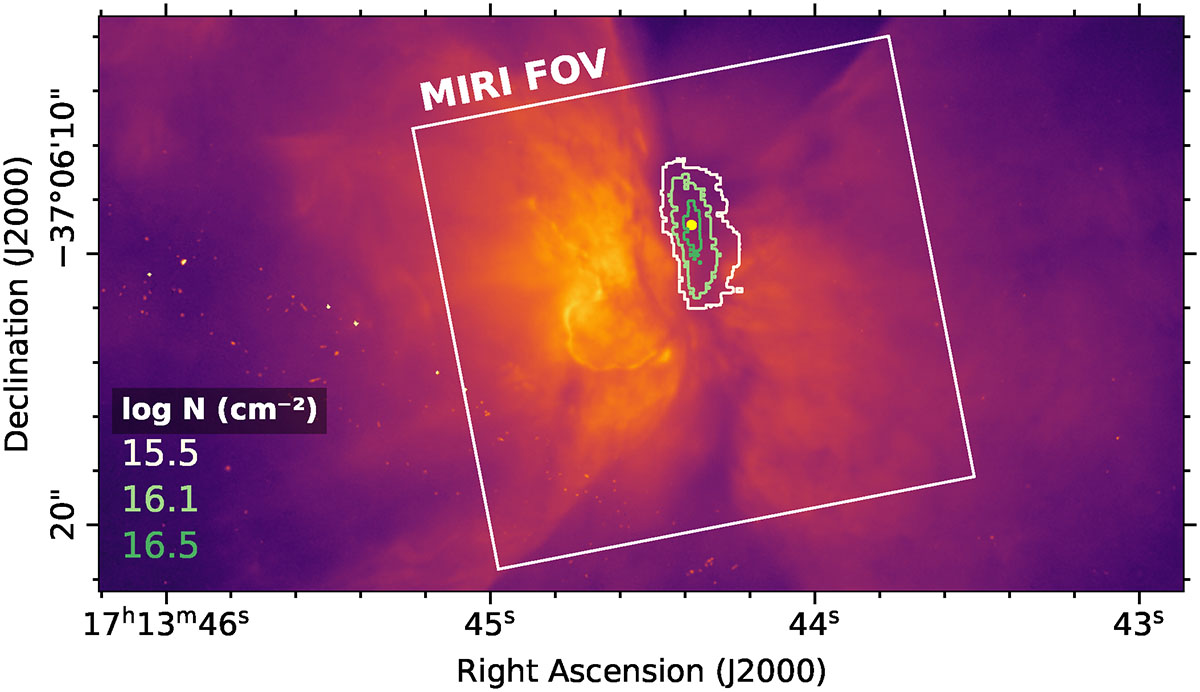
Fig. A.1.
Download original image
Location of CO2 ice in NGC 6302. The image shows HST/WFC3 observations featuring filter F656N (Kastner et al. 2022), which traces Hα emission. The JWST MIRI mosaic is indicated by the white frame. Contours show the column density of gas-phase CO2, with corresponding log N values (cm−2) provided in the lower left. The yellow dot marks the pixel position (R.A. = 17h:13m:44.402s, Dec. = -37°:06′:10.23 (J2000)) used to extract the spectra shown in Figs. 1, 2, B.1, and C.1.
Current usage metrics show cumulative count of Article Views (full-text article views including HTML views, PDF and ePub downloads, according to the available data) and Abstracts Views on Vision4Press platform.
Data correspond to usage on the plateform after 2015. The current usage metrics is available 48-96 hours after online publication and is updated daily on week days.
Initial download of the metrics may take a while.