Open Access
Fig. A.2.
Download original image
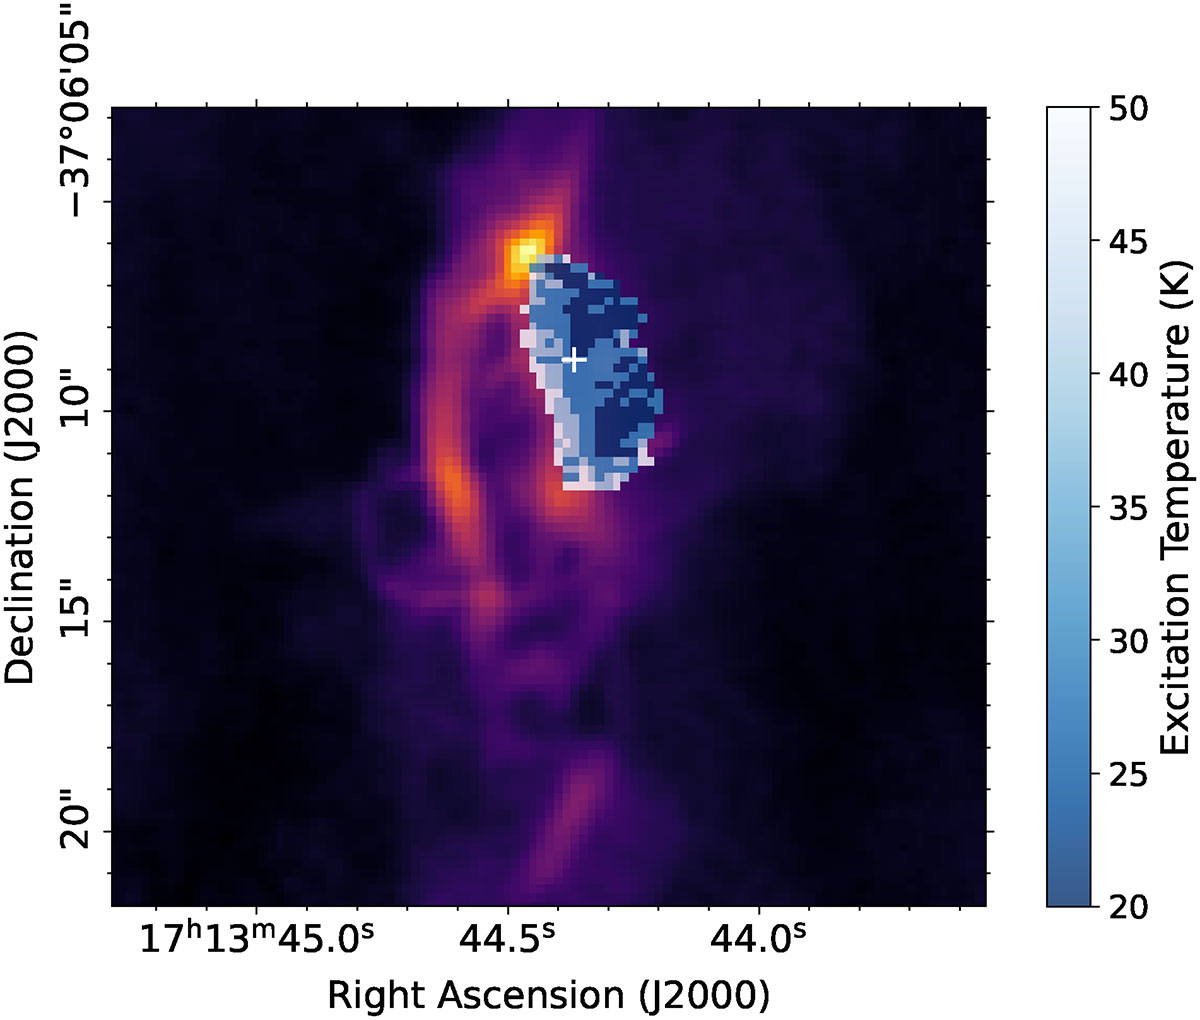
Spatial distribution of excitation temperature of CO2 gas. The derived best-fit temperature of gas-phase CO2 is mapped on the ALMA 12CO J = 2–1 map (Moraga Baez et al. 2026). The temperature map reveals two blobs of colder CO2 gas, which might indicate clumps in the torus, but needs further investigation.
Current usage metrics show cumulative count of Article Views (full-text article views including HTML views, PDF and ePub downloads, according to the available data) and Abstracts Views on Vision4Press platform.
Data correspond to usage on the plateform after 2015. The current usage metrics is available 48-96 hours after online publication and is updated daily on week days.
Initial download of the metrics may take a while.