Open Access
Fig. B.1.
Download original image
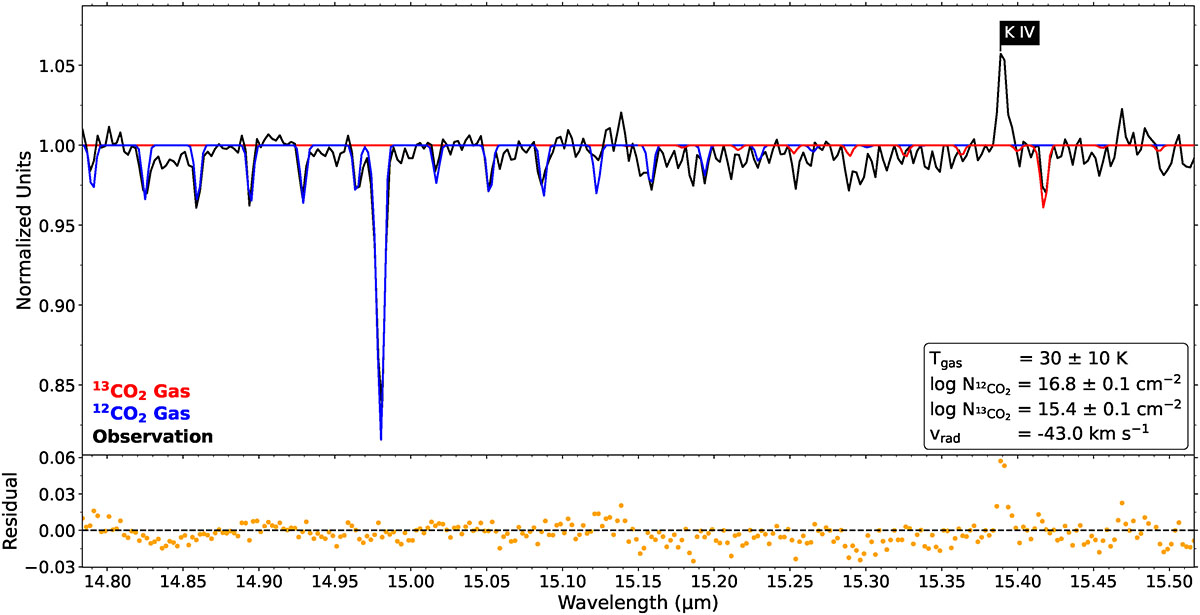
Representative fit of 12CO2 and 13CO2. The normalized observed spectrum toward the northern part of the torus facing us (R.A. = 17h:13m:44.402s, Dec. = -37°:06′:10.23″ (J2000)) is shown in black, and the best-fit 12CO2 model and 13CO2 model are shown in blue and red, respectively.
Current usage metrics show cumulative count of Article Views (full-text article views including HTML views, PDF and ePub downloads, according to the available data) and Abstracts Views on Vision4Press platform.
Data correspond to usage on the plateform after 2015. The current usage metrics is available 48-96 hours after online publication and is updated daily on week days.
Initial download of the metrics may take a while.