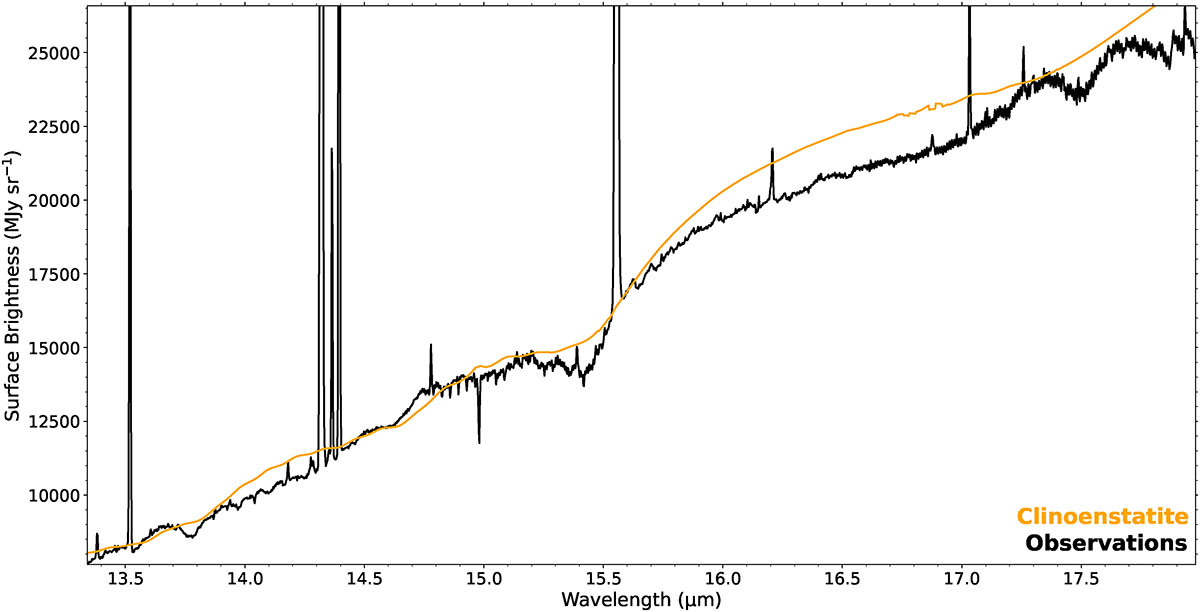
Fig. C.1.
Download original image
Comparison of observed spectrum with clinoenstatite model. The black curve represents the observed spectrum toward the same region as used to extract the spectrum in Fig. 1. The orange curve shows the modelled spectrum of clinoenstatite, derived using its optical depth profile under the assumption of blackbody emission for both the background continuum and mineral component.
Current usage metrics show cumulative count of Article Views (full-text article views including HTML views, PDF and ePub downloads, according to the available data) and Abstracts Views on Vision4Press platform.
Data correspond to usage on the plateform after 2015. The current usage metrics is available 48-96 hours after online publication and is updated daily on week days.
Initial download of the metrics may take a while.