Fig. 10
Download original image
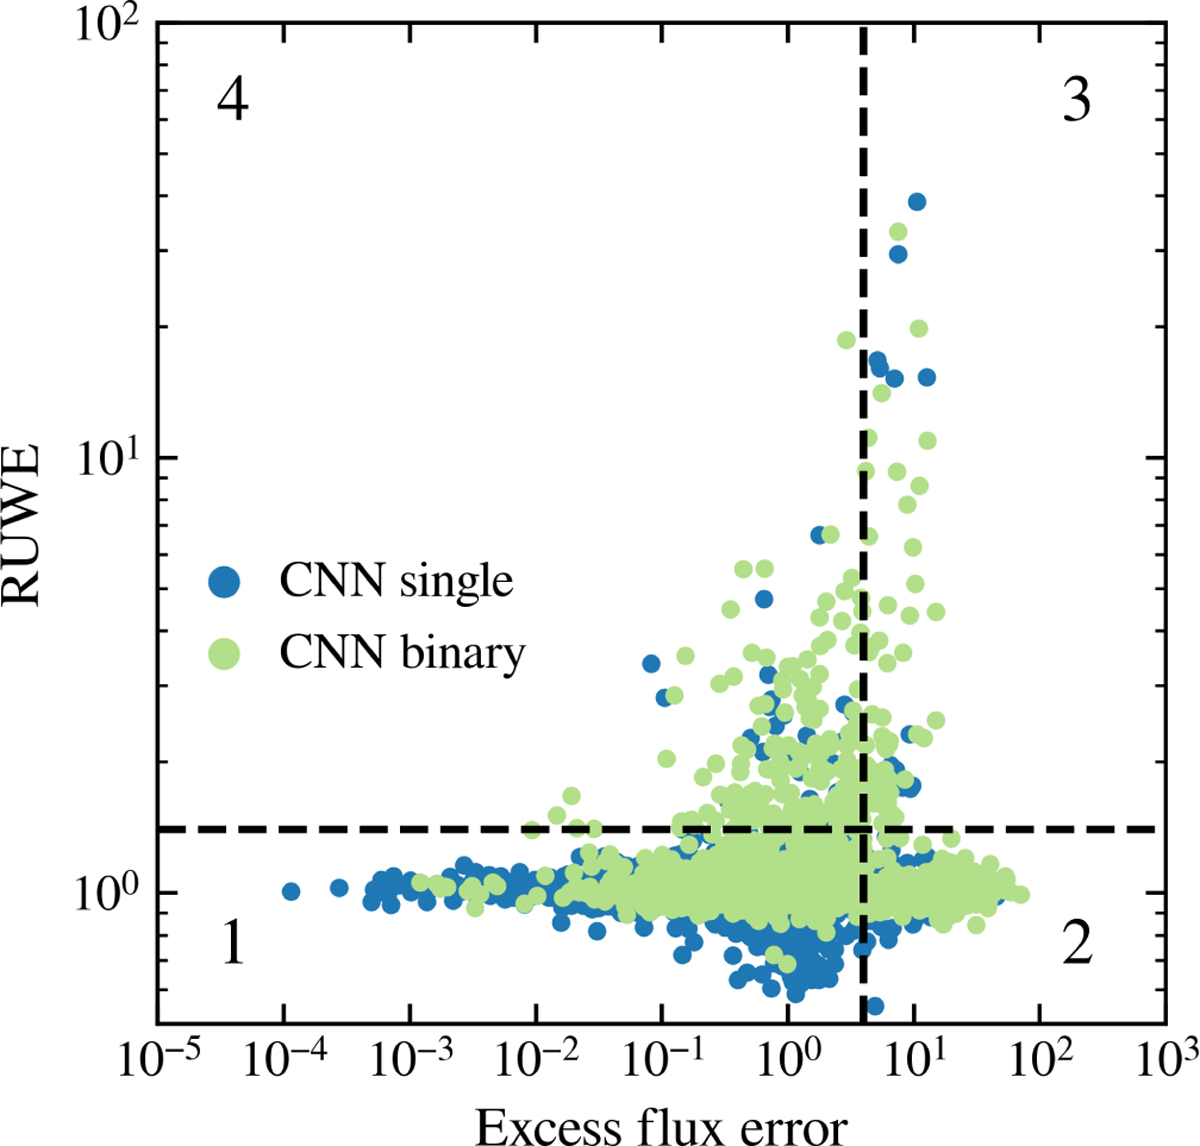
Gaia RUWE versus excess flux error of hot sds in our sample. CNN single stars are coloured in blue, CNN binaries are green. Stars from the island A are not included in this plot. The dashed lines show the variability cut-offs at RUWE =1.4 and excess flux error = 4.0 used in Culpan et al. (2022). The resulting regions of the diagram are numbered from 1 to 4.
Current usage metrics show cumulative count of Article Views (full-text article views including HTML views, PDF and ePub downloads, according to the available data) and Abstracts Views on Vision4Press platform.
Data correspond to usage on the plateform after 2015. The current usage metrics is available 48-96 hours after online publication and is updated daily on week days.
Initial download of the metrics may take a while.