Fig. A.5
Download original image
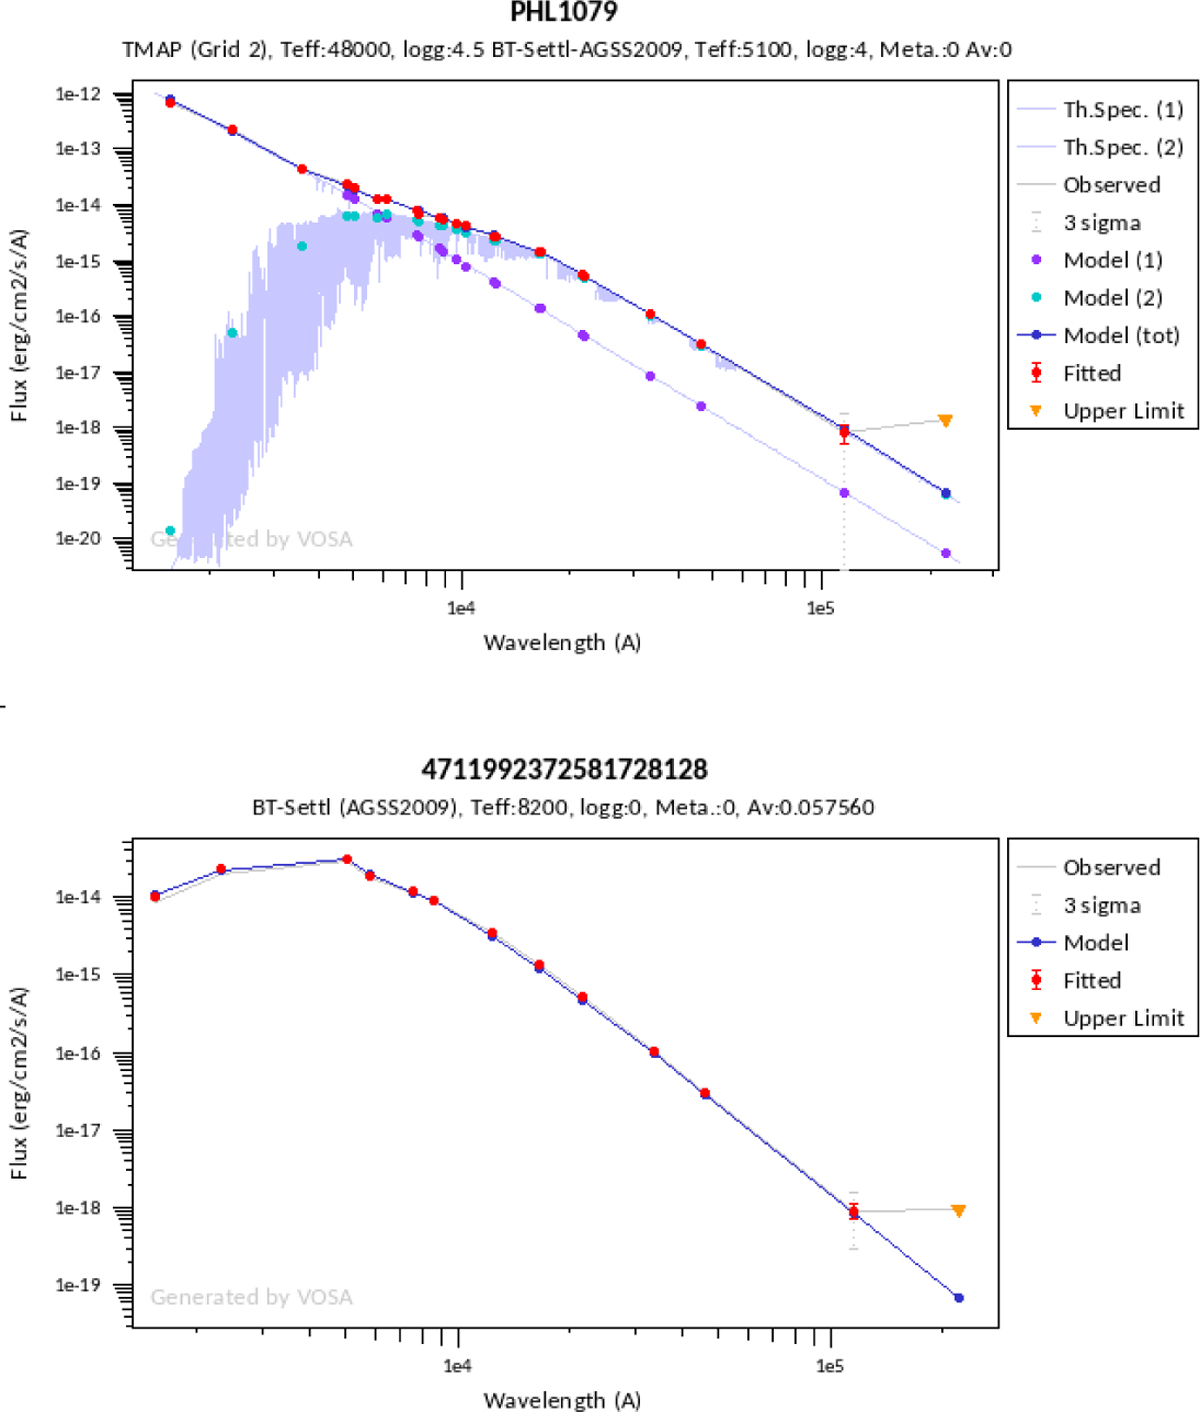
Examples of VOSA SED fits. Top panel: Fit of the binary hot hds PHL1079 (Gaia DR3 2560685069816099968). For a good fit, the observed SED (red data points) requires a combination of a TMAP model of a hot star (Model 1, purple data points) and a BT-Settl model of a cooler main sequence star (Model 2, cyan data points). Theoretical spectra for both models are shown in lavender colour. The combined model is shown in blue. Bottom panel: Fit of a main sequence BT-Settl model SED (blue) to the observed SED (red) of the island A object with Gaia DR3 4711992372581728128. In both panels, the parameters of the fitted models are given at the top of the plot. The yellow triangles mark upper limits, and are excluded from the model fitting.
Current usage metrics show cumulative count of Article Views (full-text article views including HTML views, PDF and ePub downloads, according to the available data) and Abstracts Views on Vision4Press platform.
Data correspond to usage on the plateform after 2015. The current usage metrics is available 48-96 hours after online publication and is updated daily on week days.
Initial download of the metrics may take a while.