Fig. 7
Download original image
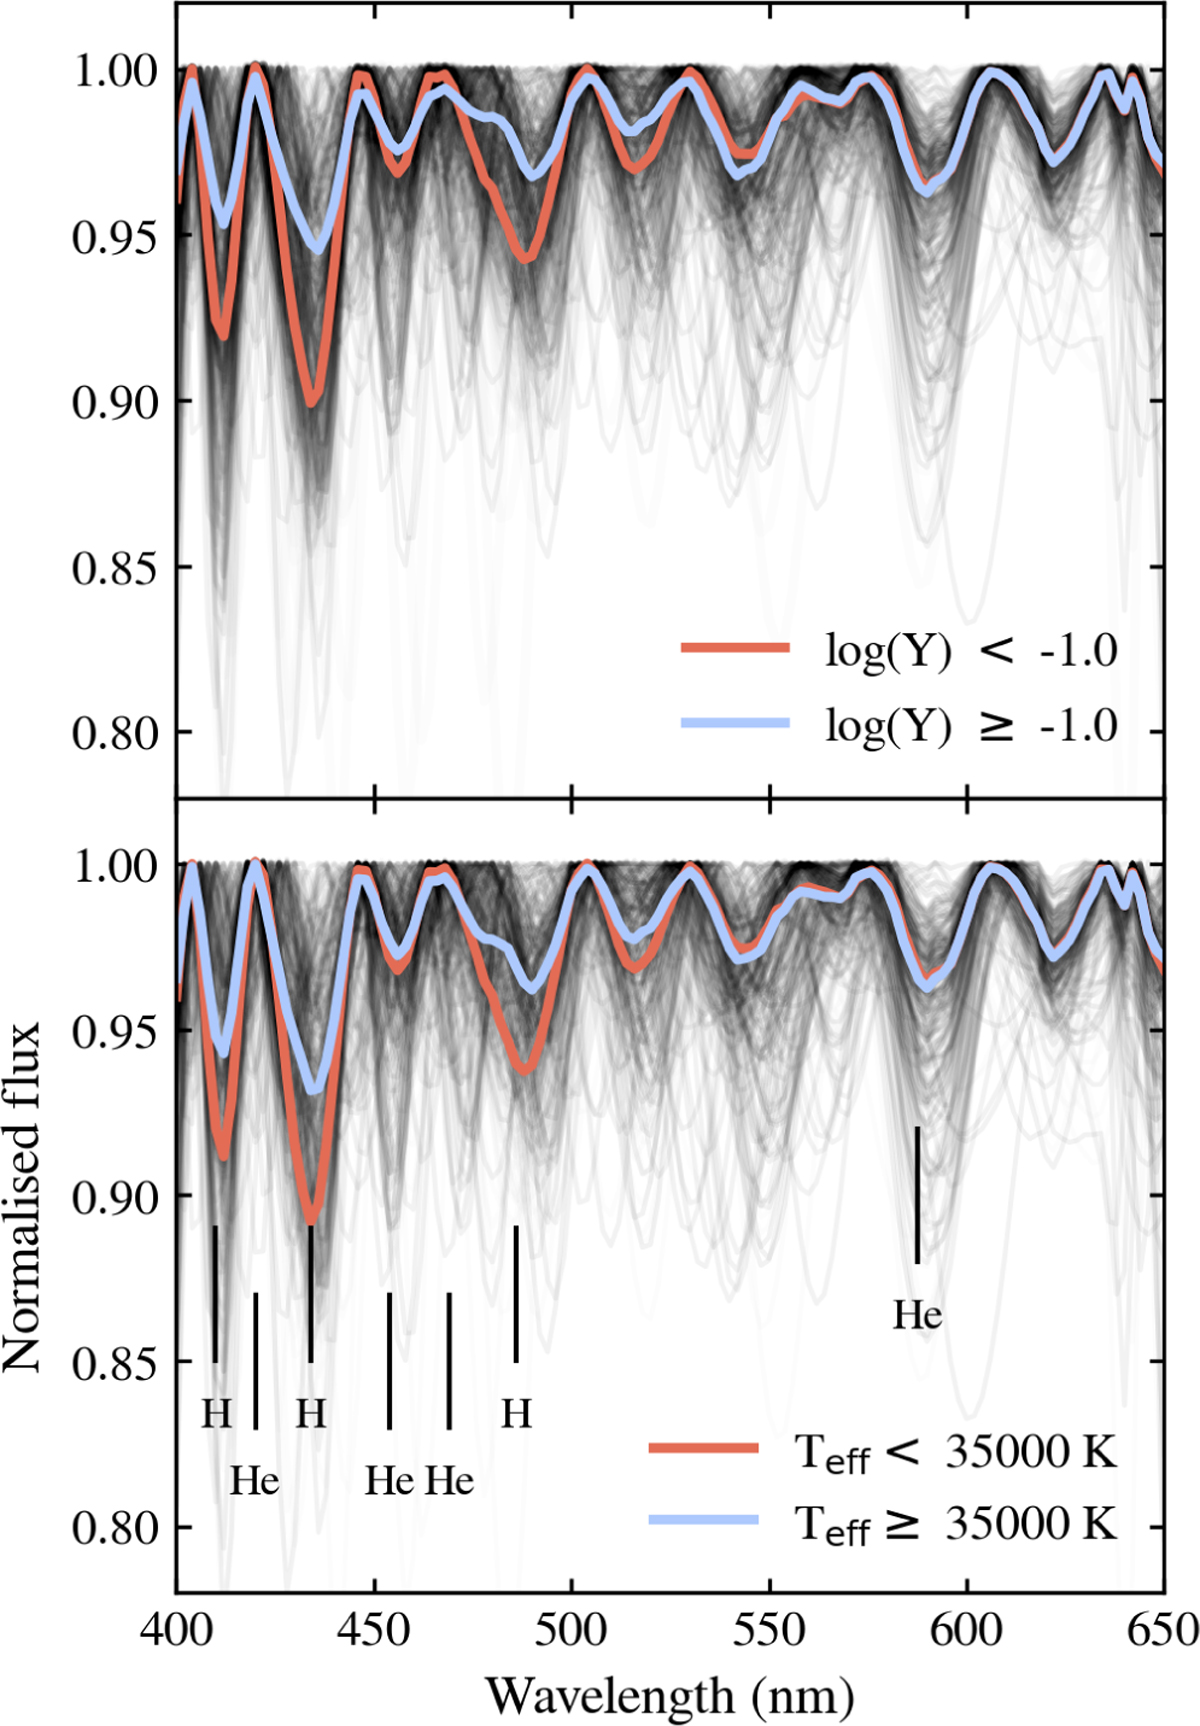
Normalised XP spectra. Top panel: mean normalised spectra of He-poor (red) and He-rich (blue) hot sds. Bottom panel: mean normalised spectra of cool (red) and hot (blue) hot sds. The locations of several relevant absorption lines are indicated in the bottom panel. Their wavelengths are 410, 434, and 486 nm (HI); 420, 454, 469 nm (HeII), and 588 nm (HeI). In both panels, the mean spectra are plotted together with 300 randomly selected normalised spectra from our full sample (black).
Current usage metrics show cumulative count of Article Views (full-text article views including HTML views, PDF and ePub downloads, according to the available data) and Abstracts Views on Vision4Press platform.
Data correspond to usage on the plateform after 2015. The current usage metrics is available 48-96 hours after online publication and is updated daily on week days.
Initial download of the metrics may take a while.