Fig. 12
Download original image
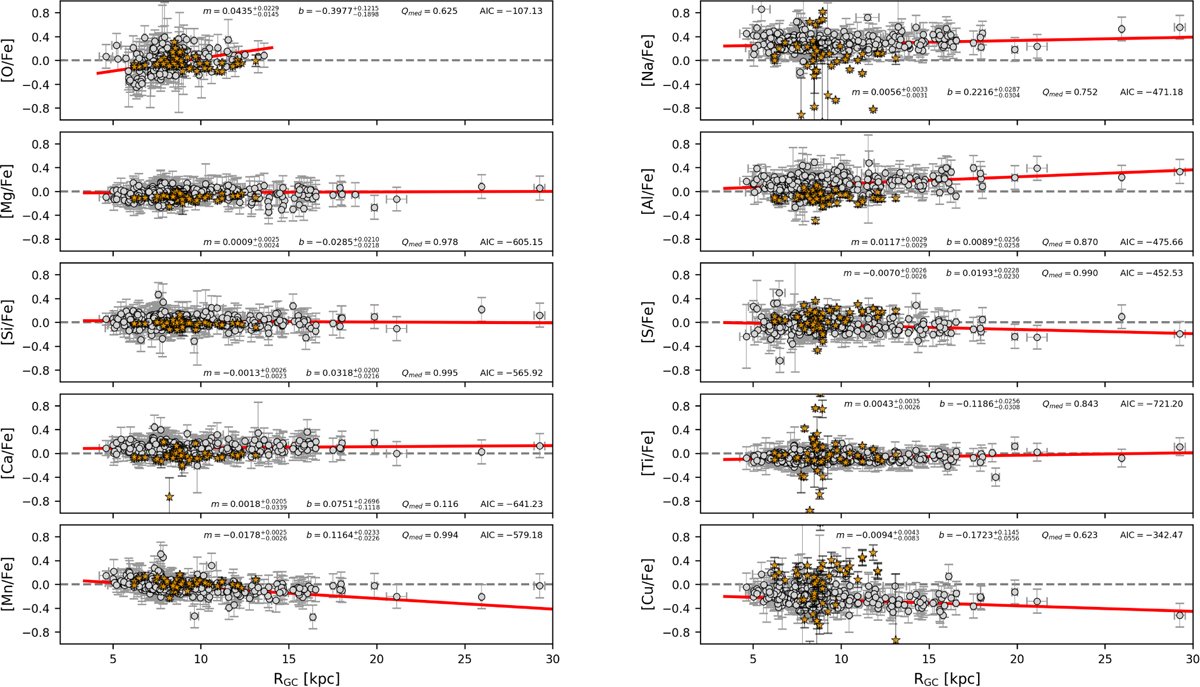
Element over iron gradients for O, Na, Mg, Al, Si, S, Ca, Ti, Mn and Cu. Iron abundances as a function of RGC for CC s are shown in grey, while orange symbols depict open clusters younger than 400 Myr from Otto et al. (2025). The red profile represents the linear fit with parameters given in the top-right box for each panel.
Current usage metrics show cumulative count of Article Views (full-text article views including HTML views, PDF and ePub downloads, according to the available data) and Abstracts Views on Vision4Press platform.
Data correspond to usage on the plateform after 2015. The current usage metrics is available 48-96 hours after online publication and is updated daily on week days.
Initial download of the metrics may take a while.