Fig. 2
Download original image
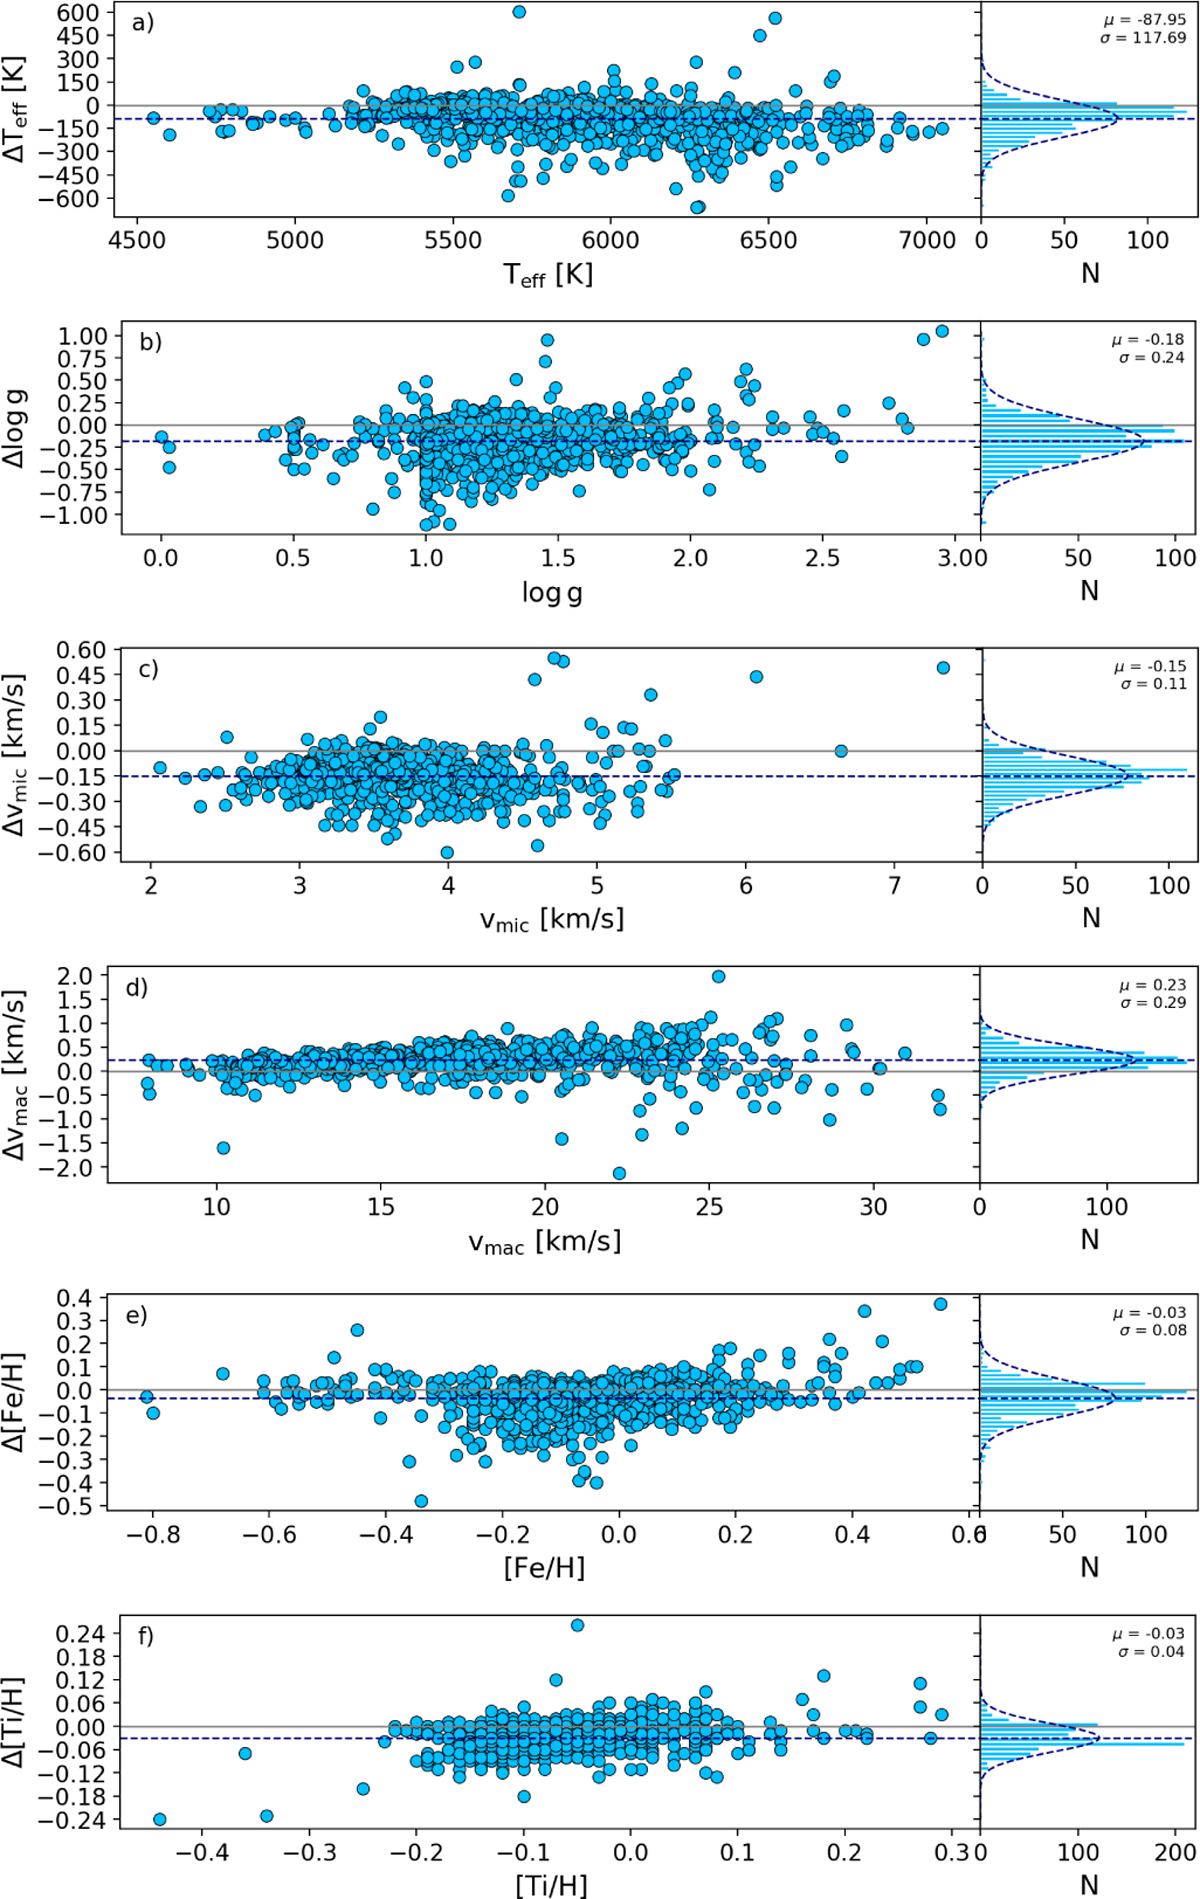
Comparison of atmospheric parameters derived under NLTE and LTE assumptions. Each panel displays the difference (NLTE – LTE) as a function of the corresponding parameter on the left, and the distribution of the difference on the right. A blue-dotted Gaussian fit is overplotted on each histogram, the mean and standard deviation are labelled in the top-right corner. The blue-dashed horizontal line shows the mean difference, while the grey solid line the null difference.
Current usage metrics show cumulative count of Article Views (full-text article views including HTML views, PDF and ePub downloads, according to the available data) and Abstracts Views on Vision4Press platform.
Data correspond to usage on the plateform after 2015. The current usage metrics is available 48-96 hours after online publication and is updated daily on week days.
Initial download of the metrics may take a while.