Open Access
Fig. 8
Download original image
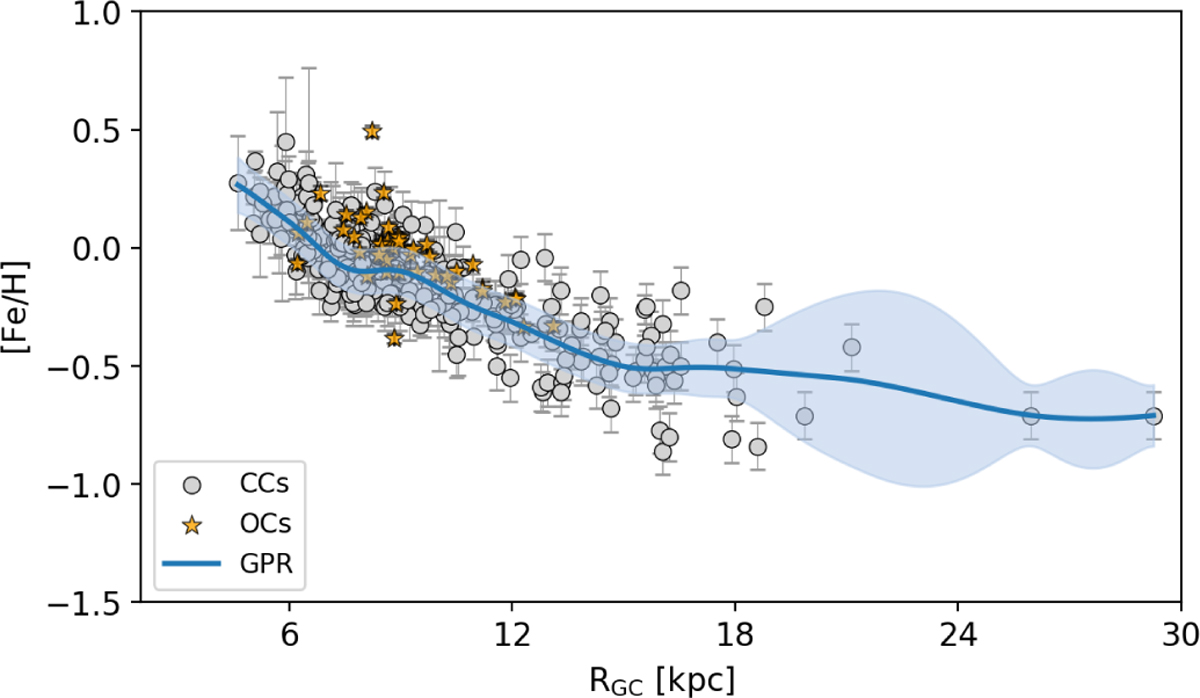
Iron abundances of CC s as a function of RGC, shown in grey. Orange symbols display open clusters younger than 400 Myr from Otto et al. (2025). GPR applied to the CCs distribution is highlighted in blue, while the shaded region highlights the uncertainties on the model.
Current usage metrics show cumulative count of Article Views (full-text article views including HTML views, PDF and ePub downloads, according to the available data) and Abstracts Views on Vision4Press platform.
Data correspond to usage on the plateform after 2015. The current usage metrics is available 48-96 hours after online publication and is updated daily on week days.
Initial download of the metrics may take a while.