Open Access
Fig. B.2
Download original image
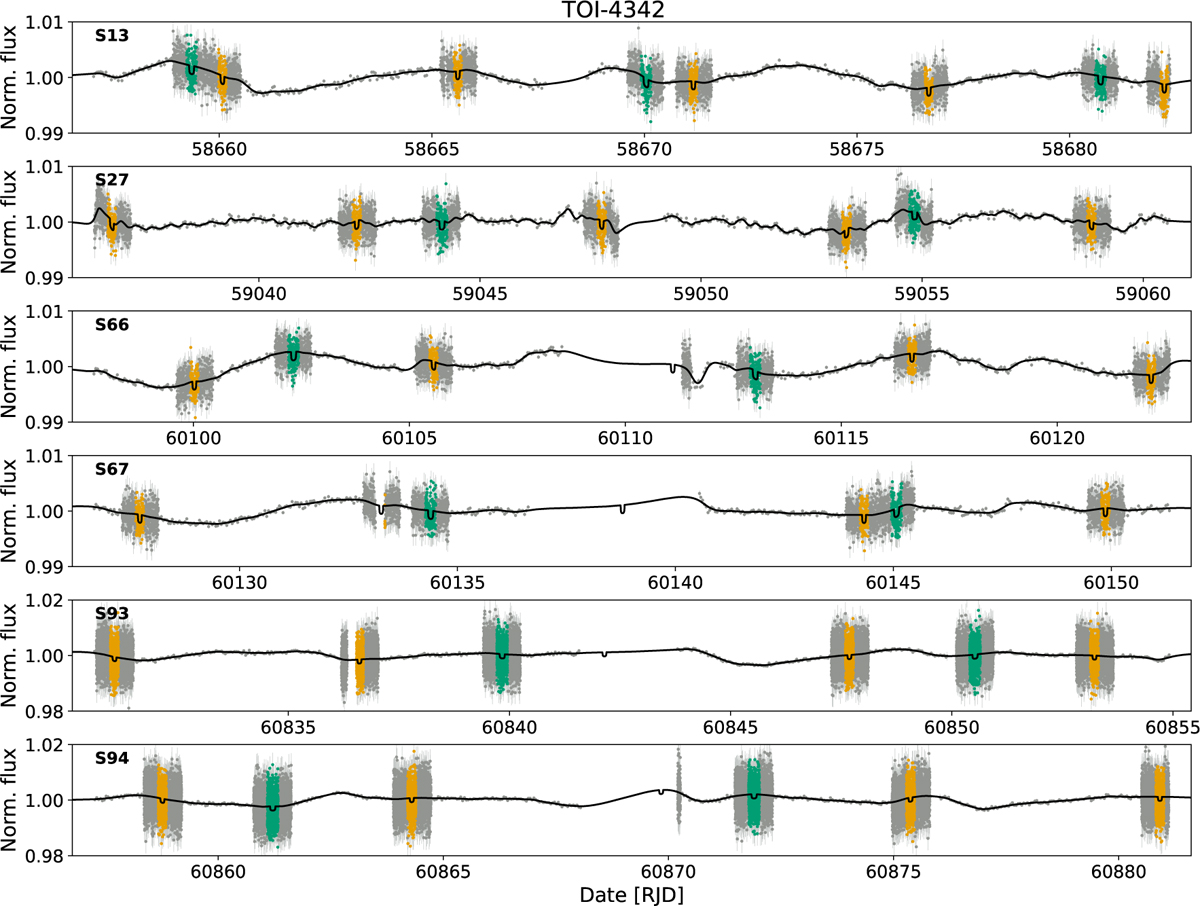
Normalized TESS PDCSAP flux light curves of TOI-4342 from the six different sectors are shown in gray, with the best-fit model in black (see Sect. 4.2.1 for details on the modeling). Transits of planets b and c are highlighted in orange and green, respectively.
Current usage metrics show cumulative count of Article Views (full-text article views including HTML views, PDF and ePub downloads, according to the available data) and Abstracts Views on Vision4Press platform.
Data correspond to usage on the plateform after 2015. The current usage metrics is available 48-96 hours after online publication and is updated daily on week days.
Initial download of the metrics may take a while.