Fig. B.4
Download original image
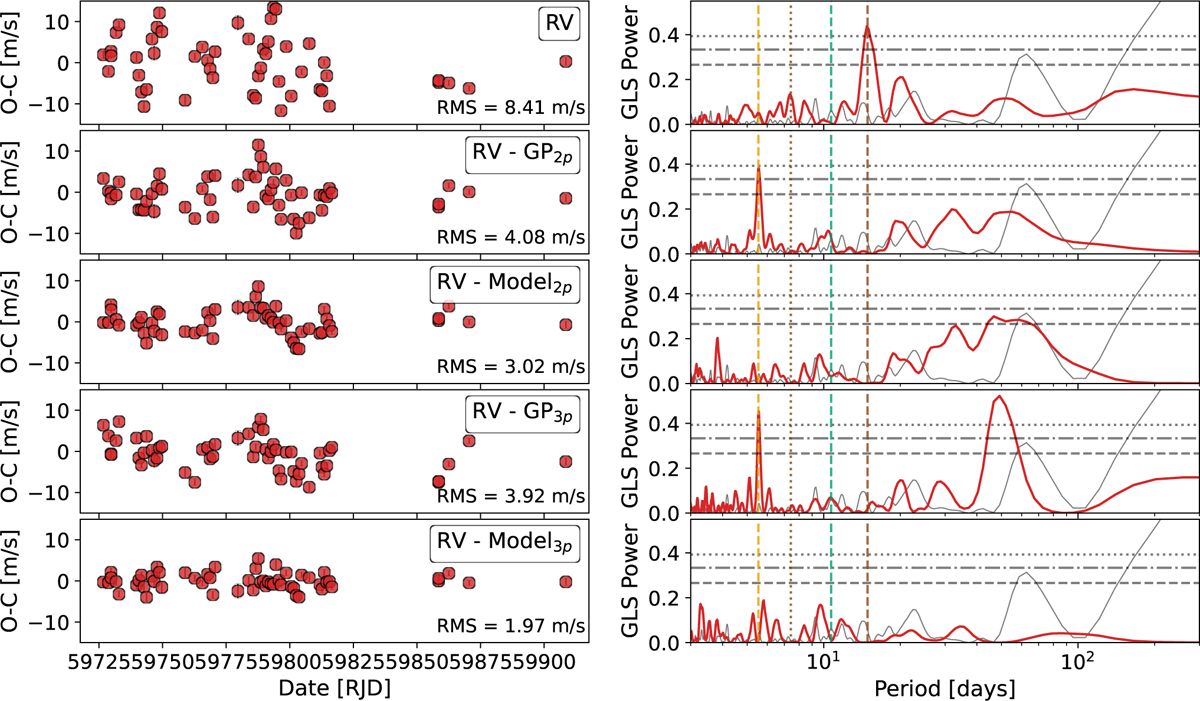
Time series of the RVs (left column) of TOI-4342 and the corresponding periodograms in red (right column) for different residual data sets. From top to bottom: observed RVs; RVs after subtraction of the GP model (2 p); RVs after subtraction of the full 2 p+ GP model; RVs after subtraction of the GP model (3 p); and RVs after subtraction of the full 3 p+GP model. The vertical brown lines indicate the stellar rotation period at ∼14 days (dashed line) and its first harmonic at ∼7 days (dotted line). The orange and green vertical dashed lines mark the expected orbital periods of planets b and c, respectively. The 10%, 1%, and 0.1% False Alarm Probability (FAP) levels are shown as gray horizontal dashed, dash-dotted, and dotted lines, respectively.
Current usage metrics show cumulative count of Article Views (full-text article views including HTML views, PDF and ePub downloads, according to the available data) and Abstracts Views on Vision4Press platform.
Data correspond to usage on the plateform after 2015. The current usage metrics is available 48-96 hours after online publication and is updated daily on week days.
Initial download of the metrics may take a while.