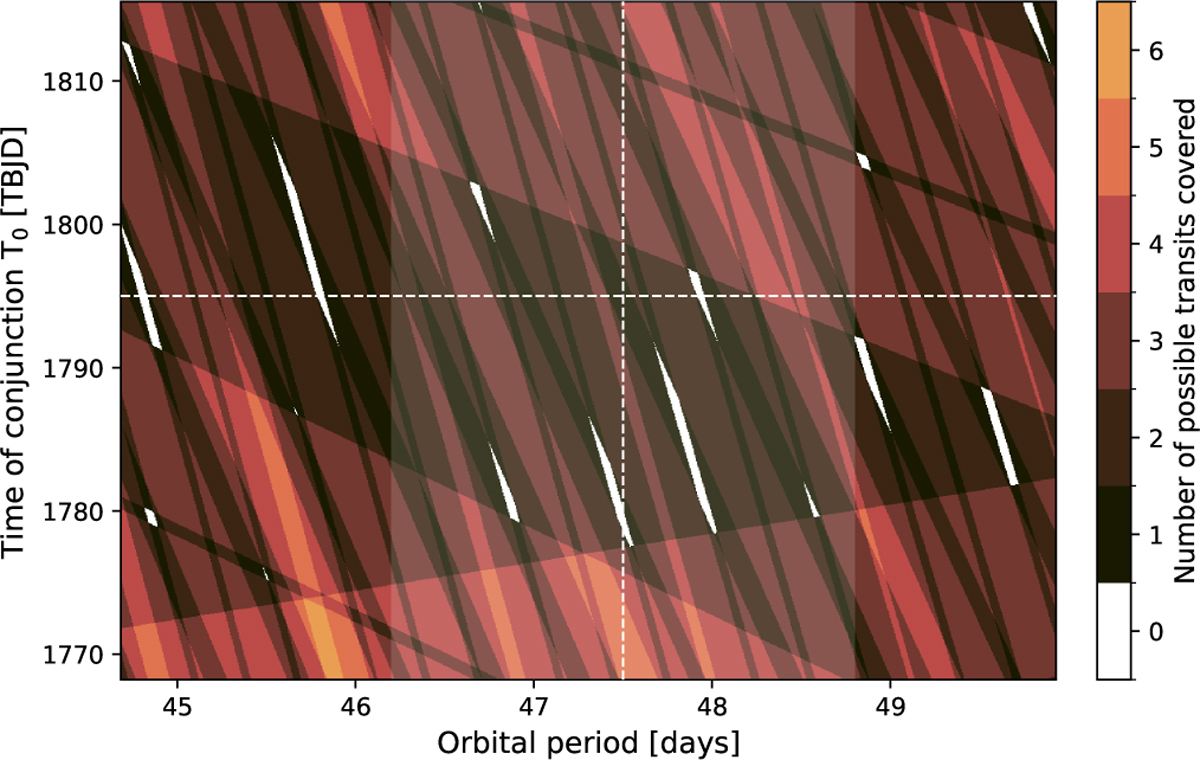
Fig. C.1
Download original image
TESS transit coverage map for the candidate planet TOI-4342 d. Each pixel corresponds to a combination of orbital period (P) and time of conjunction (T0). The color scale indicates the number of possible transits that fall within the TESS observation windows. The dashed white lines mark the median values of Pd and T0, d derived from the RV analysis, while the shaded white bands show the corresponding 1 σ uncertainties of Pd. The regions in white colors correspond to parameter combinations for which not covered by TESS observations.
Current usage metrics show cumulative count of Article Views (full-text article views including HTML views, PDF and ePub downloads, according to the available data) and Abstracts Views on Vision4Press platform.
Data correspond to usage on the plateform after 2015. The current usage metrics is available 48-96 hours after online publication and is updated daily on week days.
Initial download of the metrics may take a while.