Fig. 5
Download original image
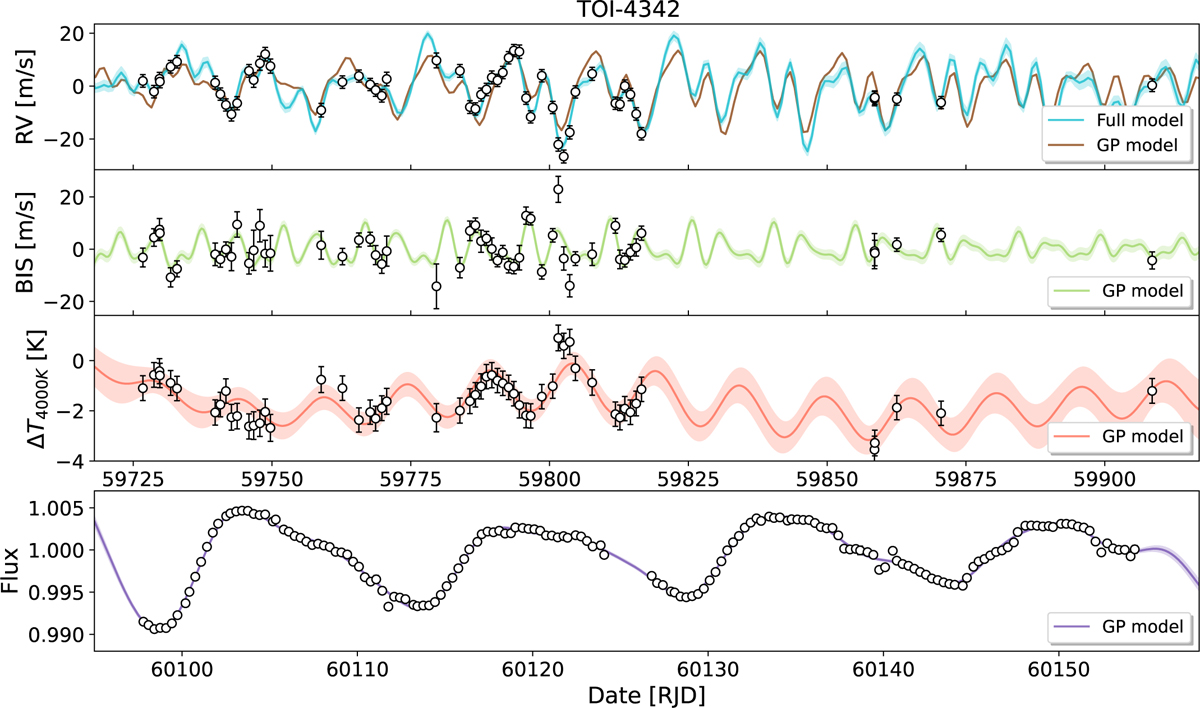
Time series of the RVs, FWHM, Δ T4000 K, and TESS binned photometry (sector 66 and 67) of TOI-4342 after correction for the inferred offsets. The measurements are shown as white dots with error bars that include the fit jitter. In the top panel, the full RV + activity model with its 1 σ uncertainty is shown in blue, while the GP-only component is shown in brown. In the three other panels, the activity models are displayed in green, pink, and purple, with their associated shaded uncertainties.
Current usage metrics show cumulative count of Article Views (full-text article views including HTML views, PDF and ePub downloads, according to the available data) and Abstracts Views on Vision4Press platform.
Data correspond to usage on the plateform after 2015. The current usage metrics is available 48-96 hours after online publication and is updated daily on week days.
Initial download of the metrics may take a while.