Fig. B.1
Download original image
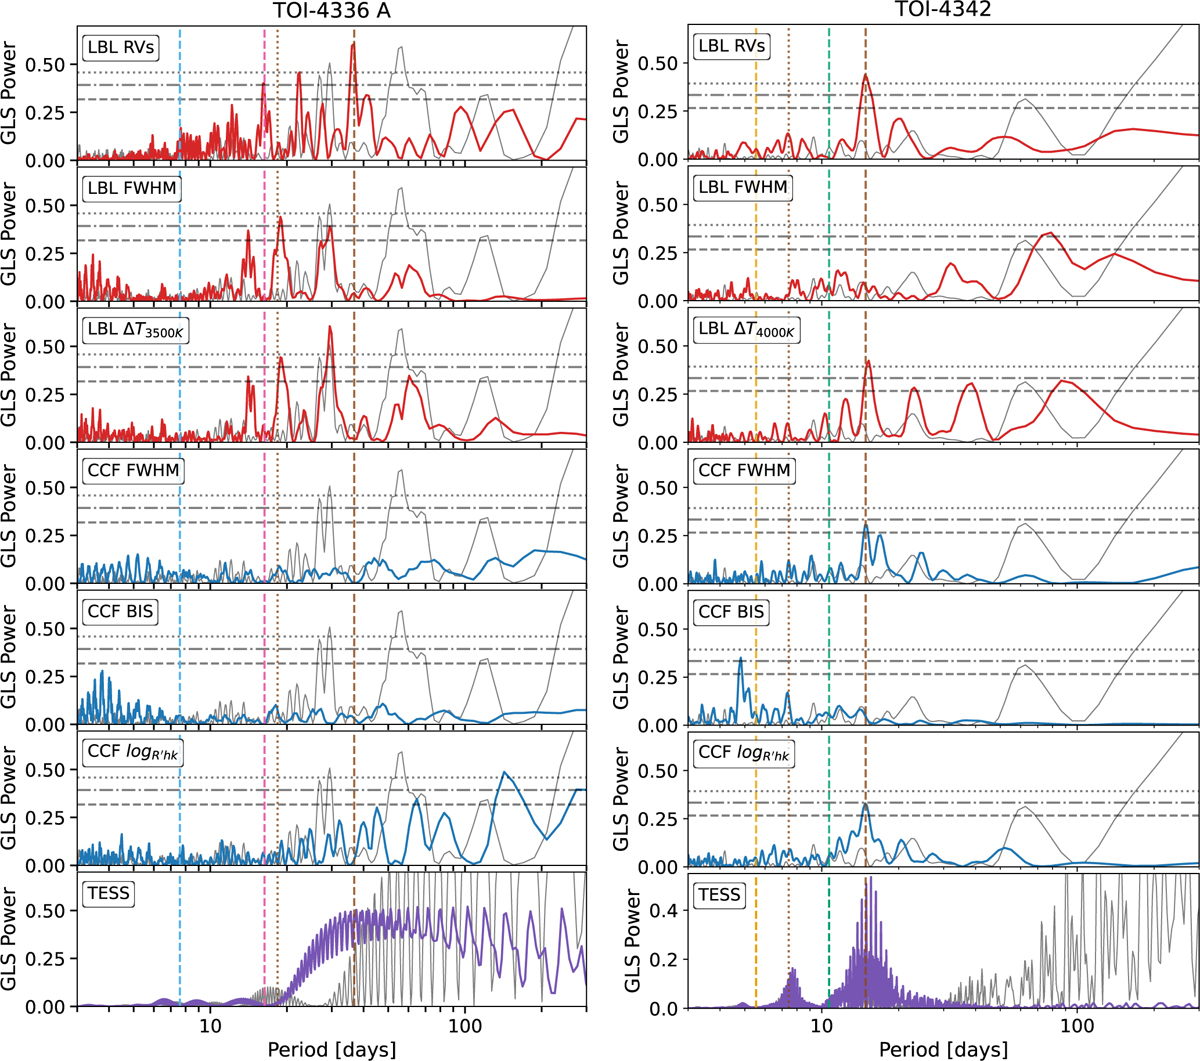
GLS periodograms of the ESPRESSO RVs and activity indicators for TOI-4336 A (left) and TOI-4342 (right) obtained with the LBL (red) and CCF (blue) methods, and of TESS photometry (purple). The gray curve corresponds to the window function. The vertical brown lines indicate the possible stellar rotation period at ∼36 days (resp ∼14 days) (dashed line) and its first harmonic at ∼18 days (resp ∼7 days) (dotted line). The pink and blue (resp orange and green) vertical dashed lines mark the expected orbital periods of planets b and c, respectively. The 10%, 1%, and 0.1% False Alarm Probability (FAP) levels are shown as gray horizontal dashed, dash-dotted, and dotted lines, respectively.
Current usage metrics show cumulative count of Article Views (full-text article views including HTML views, PDF and ePub downloads, according to the available data) and Abstracts Views on Vision4Press platform.
Data correspond to usage on the plateform after 2015. The current usage metrics is available 48-96 hours after online publication and is updated daily on week days.
Initial download of the metrics may take a while.