Open Access
Fig. 1.
Download original image
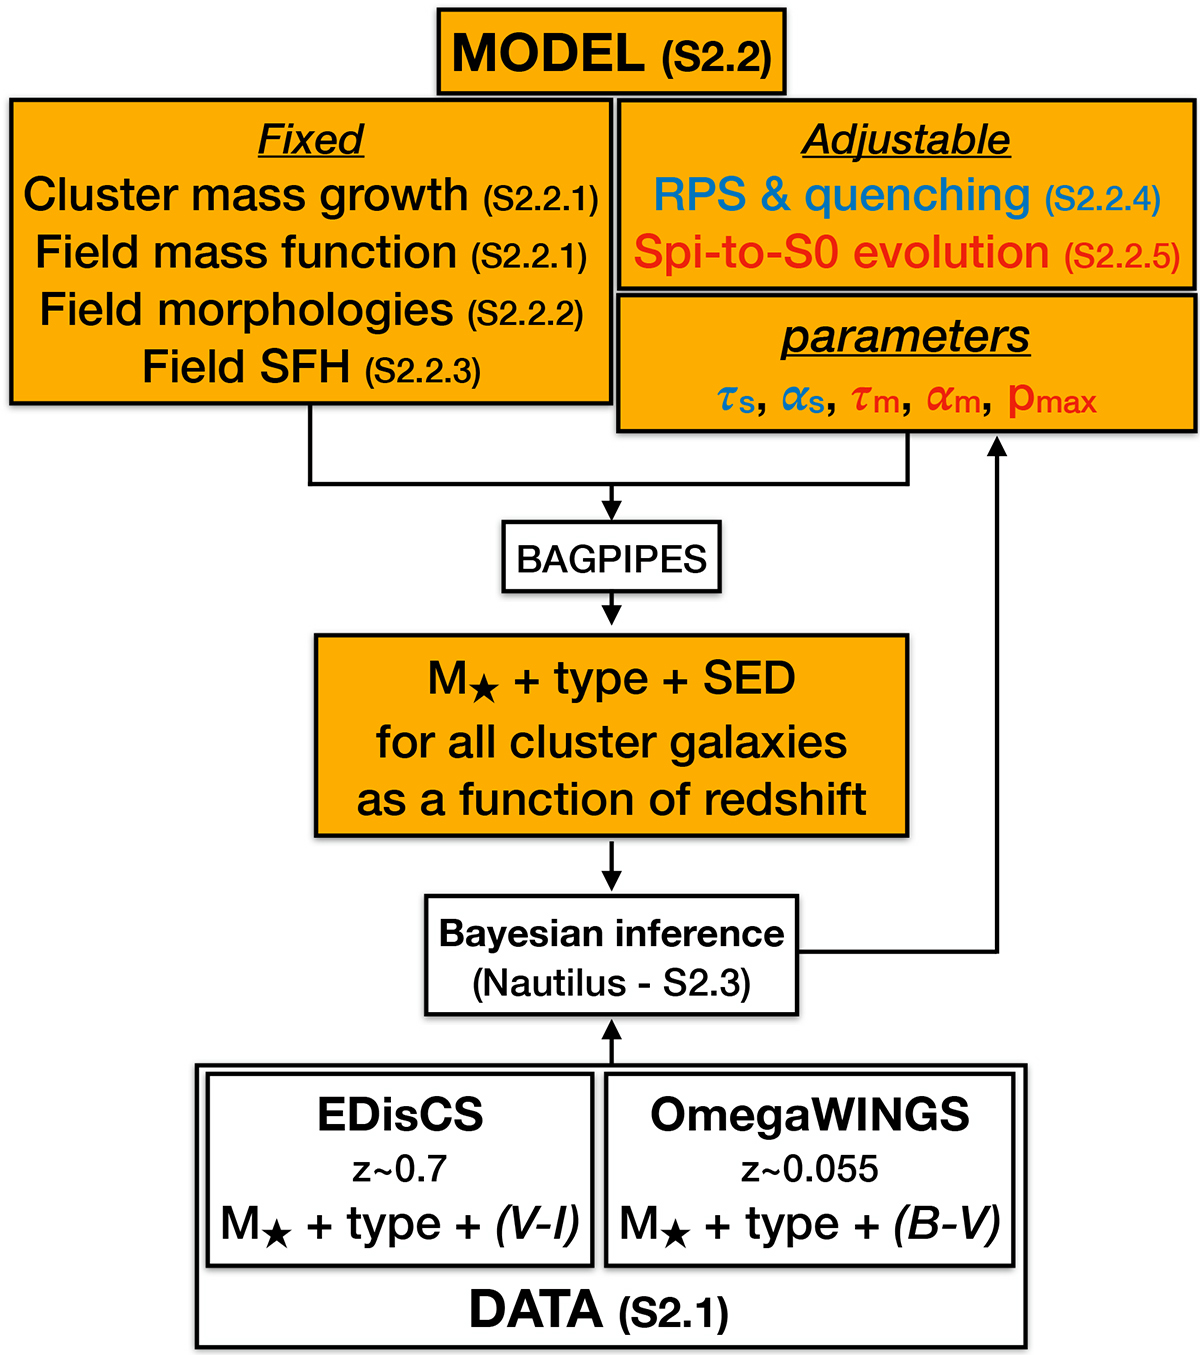
Flowchart illustrating our method. White blocks show pre-existing dataset or software packages. Yellow blocks show the new products built for this study. The chart indicates also the Sections of the main text that provide details on a given part of the method.
Current usage metrics show cumulative count of Article Views (full-text article views including HTML views, PDF and ePub downloads, according to the available data) and Abstracts Views on Vision4Press platform.
Data correspond to usage on the plateform after 2015. The current usage metrics is available 48-96 hours after online publication and is updated daily on week days.
Initial download of the metrics may take a while.