Open Access
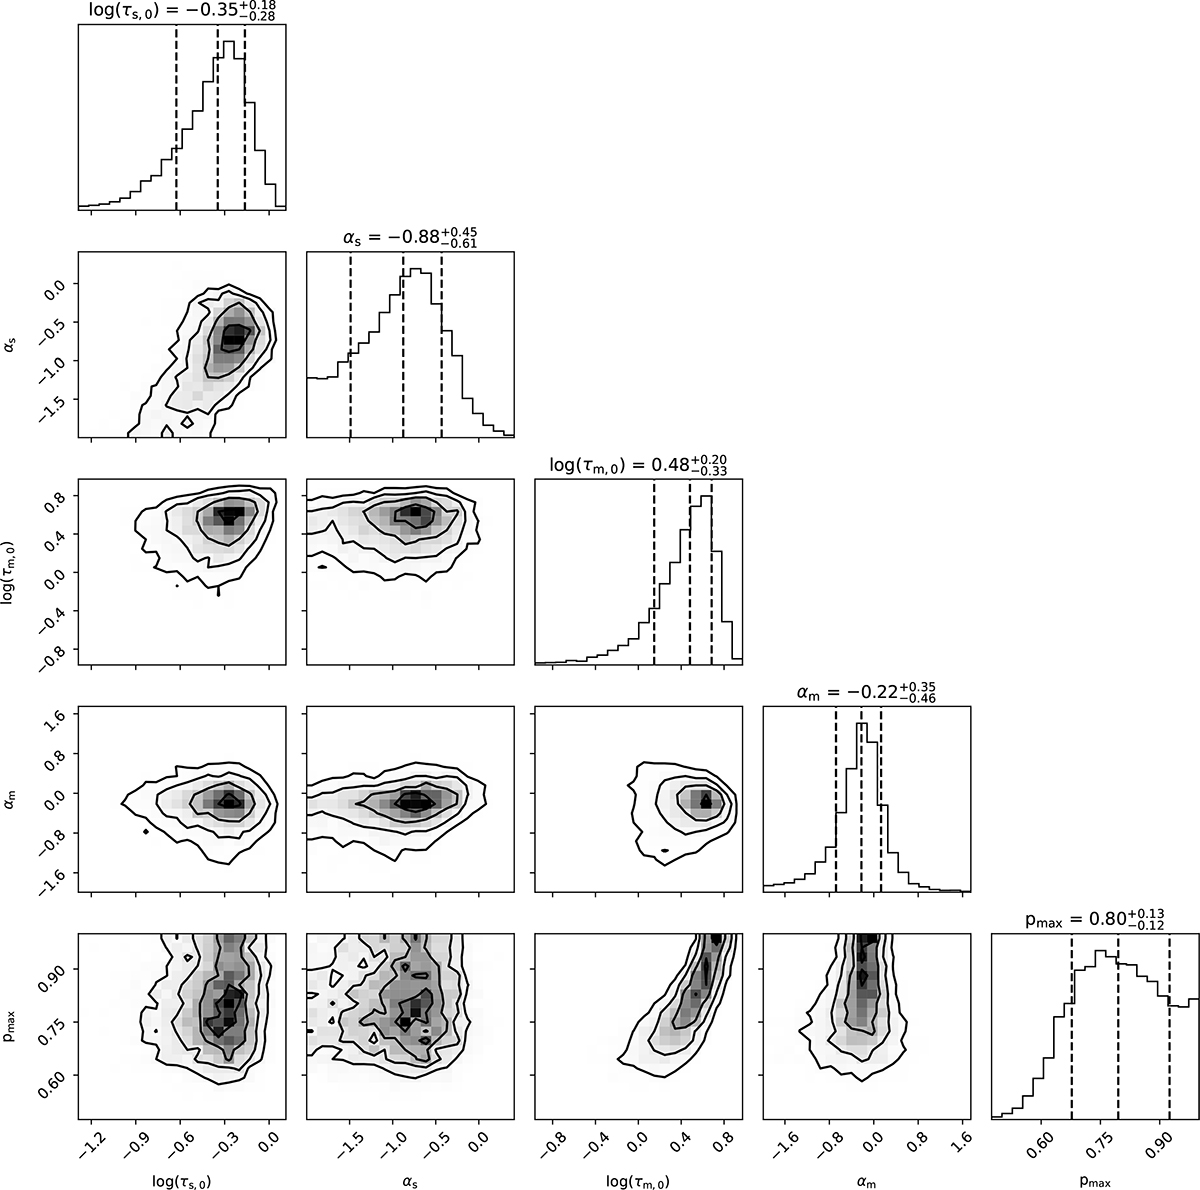
Fig. B.1.
Download original image
Corner plots showing the correlation between the various parameters (shaded regions, with contours at arbitrary iso-density levels) along with their marginalised probability distribution (histograms on top) for our model using the MS of Popesso et al. (2019).
Current usage metrics show cumulative count of Article Views (full-text article views including HTML views, PDF and ePub downloads, according to the available data) and Abstracts Views on Vision4Press platform.
Data correspond to usage on the plateform after 2015. The current usage metrics is available 48-96 hours after online publication and is updated daily on week days.
Initial download of the metrics may take a while.