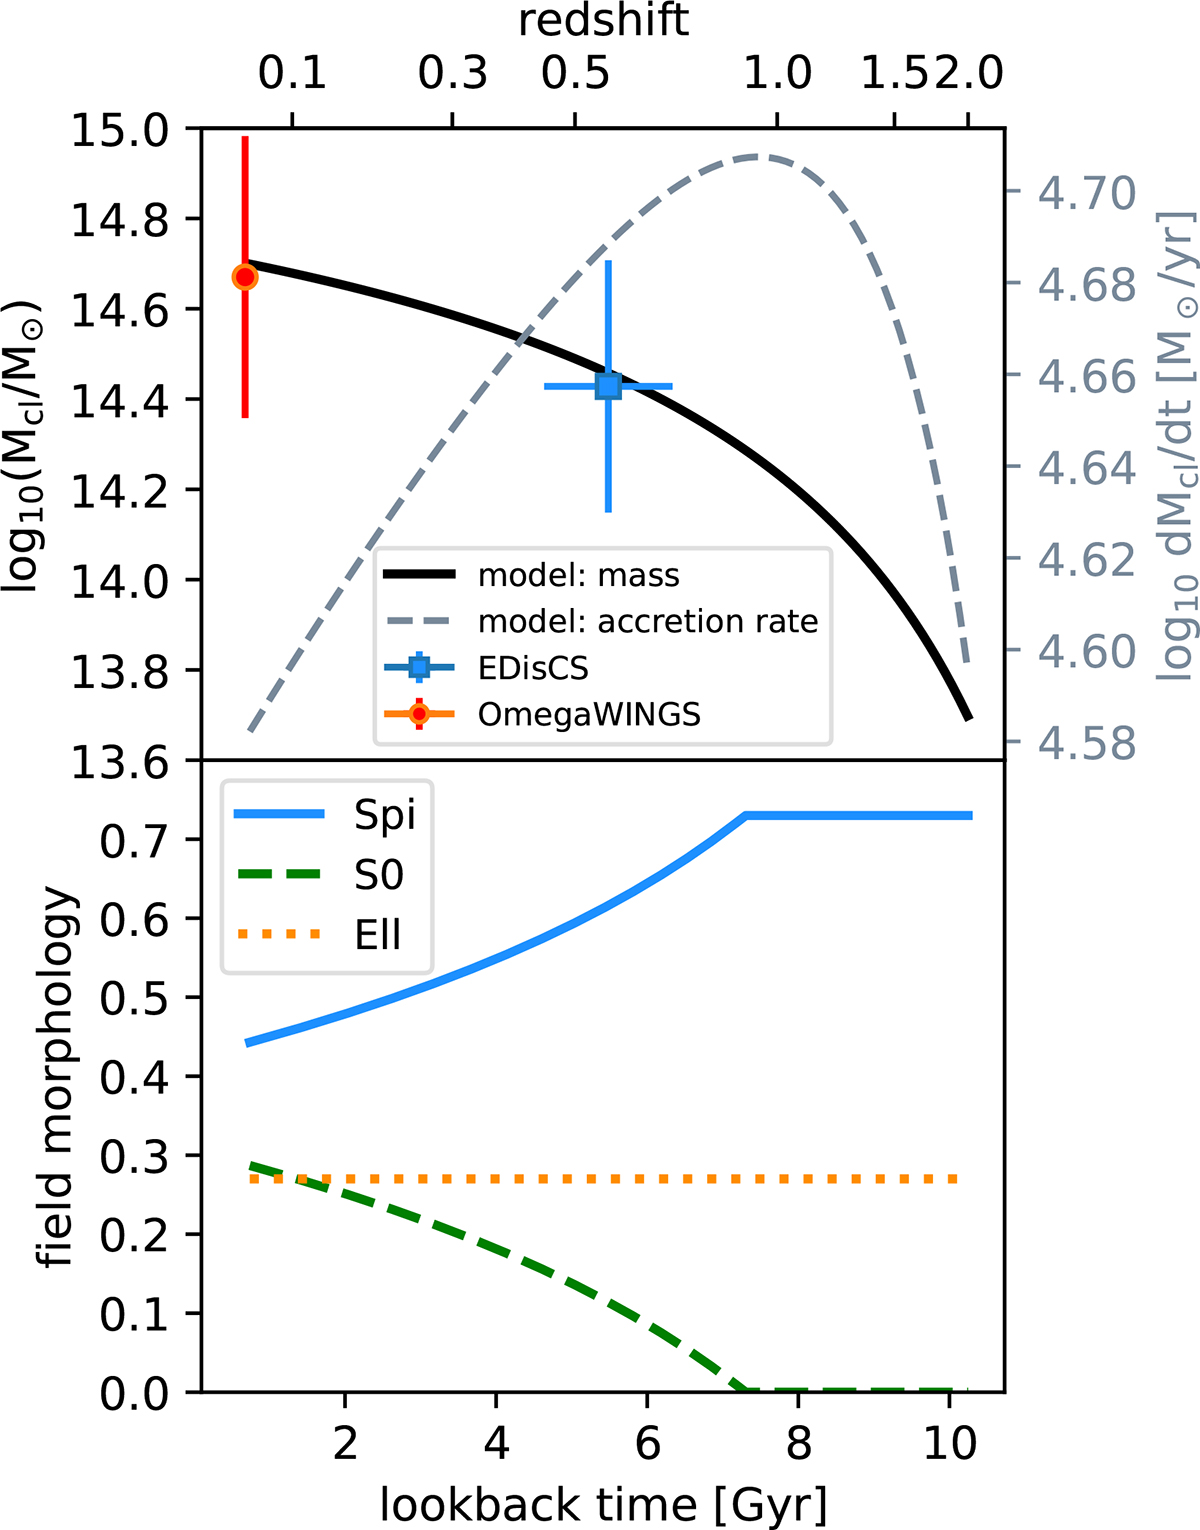
Fig. 2.
Download original image
Evolutionary properties of our model cluster. Top panel: Mass (solid black curve) and accretion rate (dashed grey curve) vs redshift for a cluster with Mcl = 5 × 10¹⁴ M⊙ at z = 0.055. The blue square and the red circle show the median Mcl and redshifts of the EDisCS and OmegaWINGS clusters, respectively, with the error bars corresponding to half the difference between the 84th and 16th percentiles of the galaxy distribution. Bottom panel: Morphology fractions for field galaxies that join the cluster as a function of z, assumed to be independent of the galaxy M★.
Current usage metrics show cumulative count of Article Views (full-text article views including HTML views, PDF and ePub downloads, according to the available data) and Abstracts Views on Vision4Press platform.
Data correspond to usage on the plateform after 2015. The current usage metrics is available 48-96 hours after online publication and is updated daily on week days.
Initial download of the metrics may take a while.