Fig. 3.
Download original image
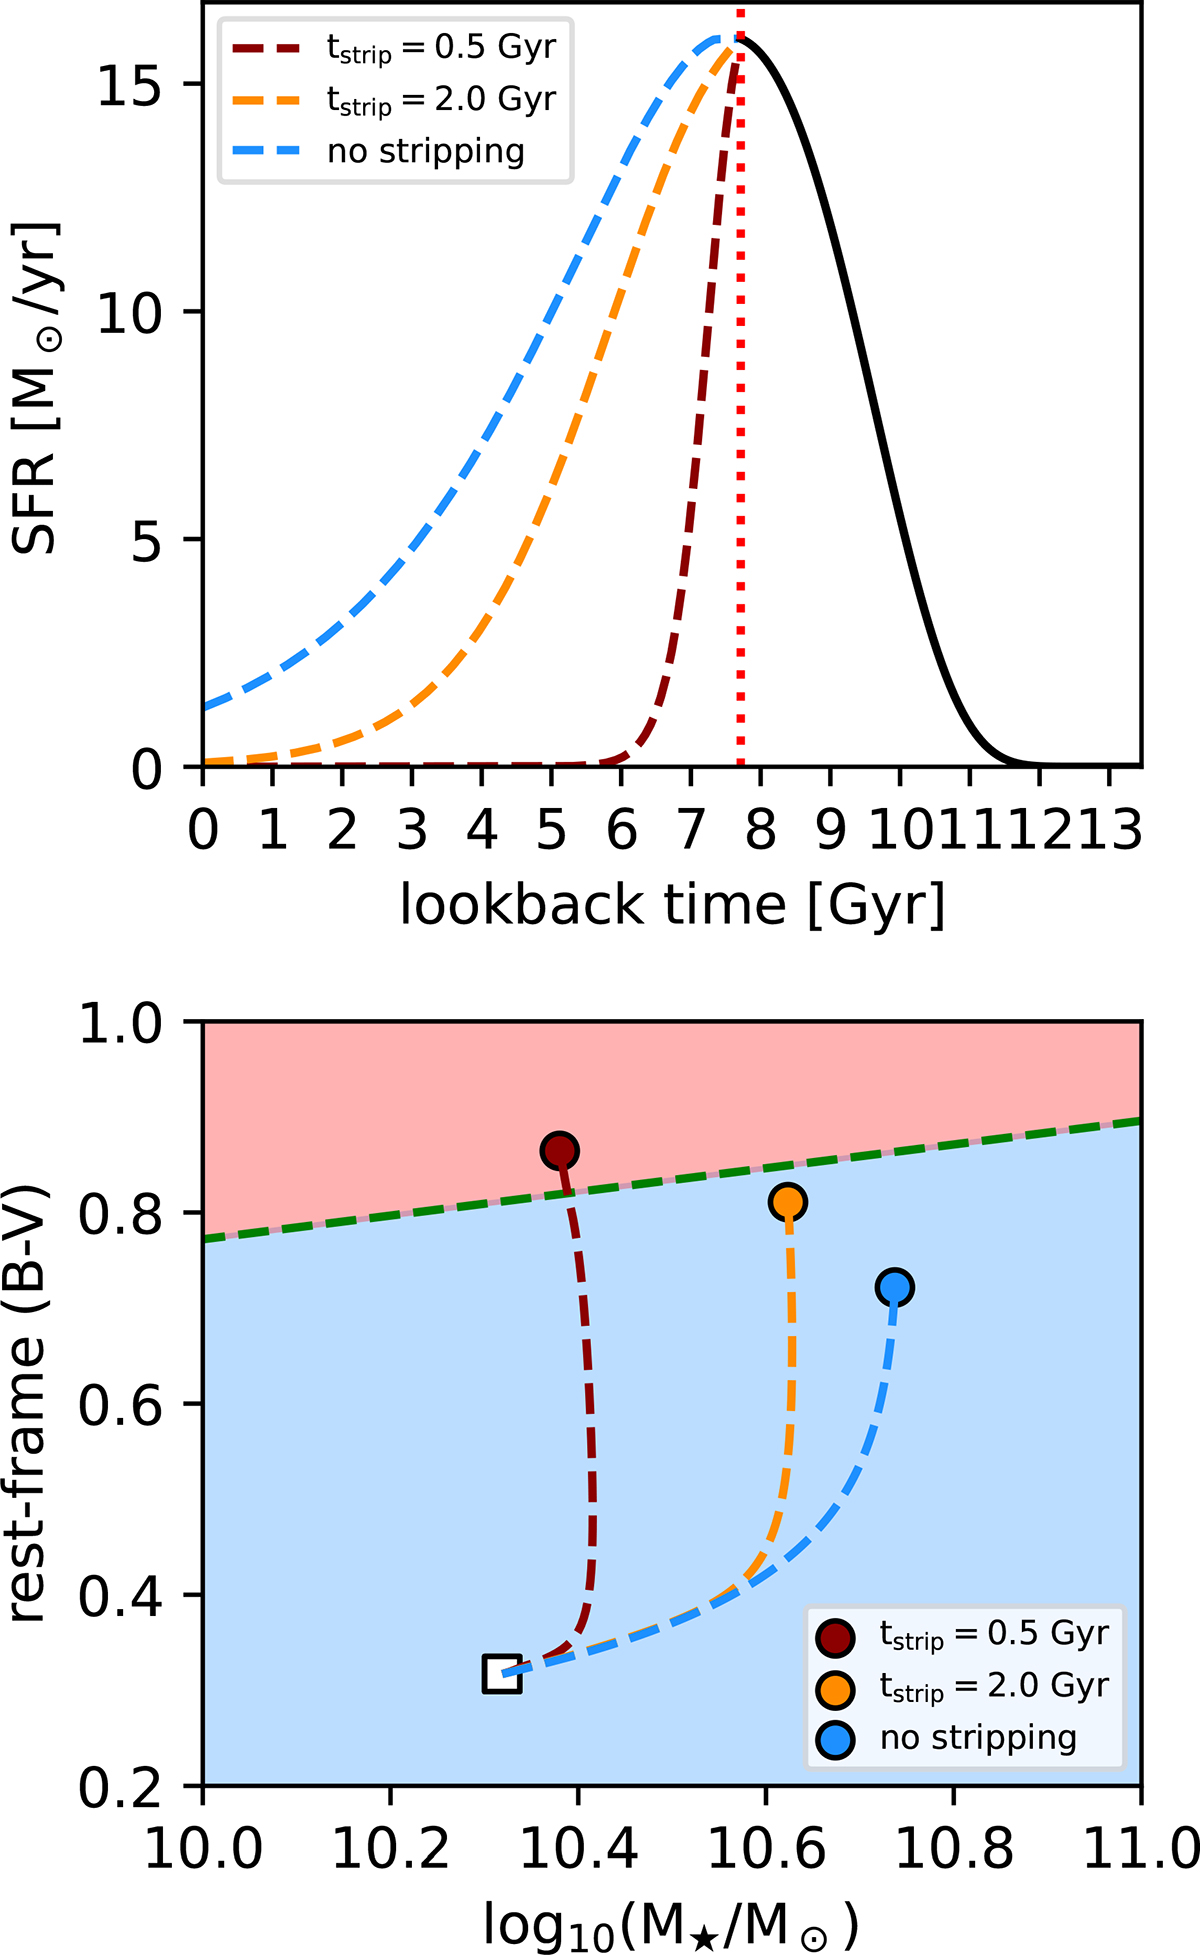
Photometric evolution and mass build-up of an idealised main-sequence galaxy with initial M★ ≃ 2 × 10¹⁰ M⊙ that joins our cluster model at z = 1, for stripping timescales of 0.5 and 2.0 Gyr (dark-red and orange curves, respectively), and for a case without stripping (blue curve). Top panel: SFR as a function of the look-back time. For times larger than ∼8 Gyr (z > 1), the three models share a common SFH shown by the solid black curve. Bottom panel: Galaxy evolution in the rest-frame (B − V) colour vs M★ plane. The white square shows the initial values at z = 1, the coloured circles show the final (z = 0) values for the three scenarios considered. The green dashed-line separates the red sequence from the blue cloud (from Vulcani et al. 2022).
Current usage metrics show cumulative count of Article Views (full-text article views including HTML views, PDF and ePub downloads, according to the available data) and Abstracts Views on Vision4Press platform.
Data correspond to usage on the plateform after 2015. The current usage metrics is available 48-96 hours after online publication and is updated daily on week days.
Initial download of the metrics may take a while.