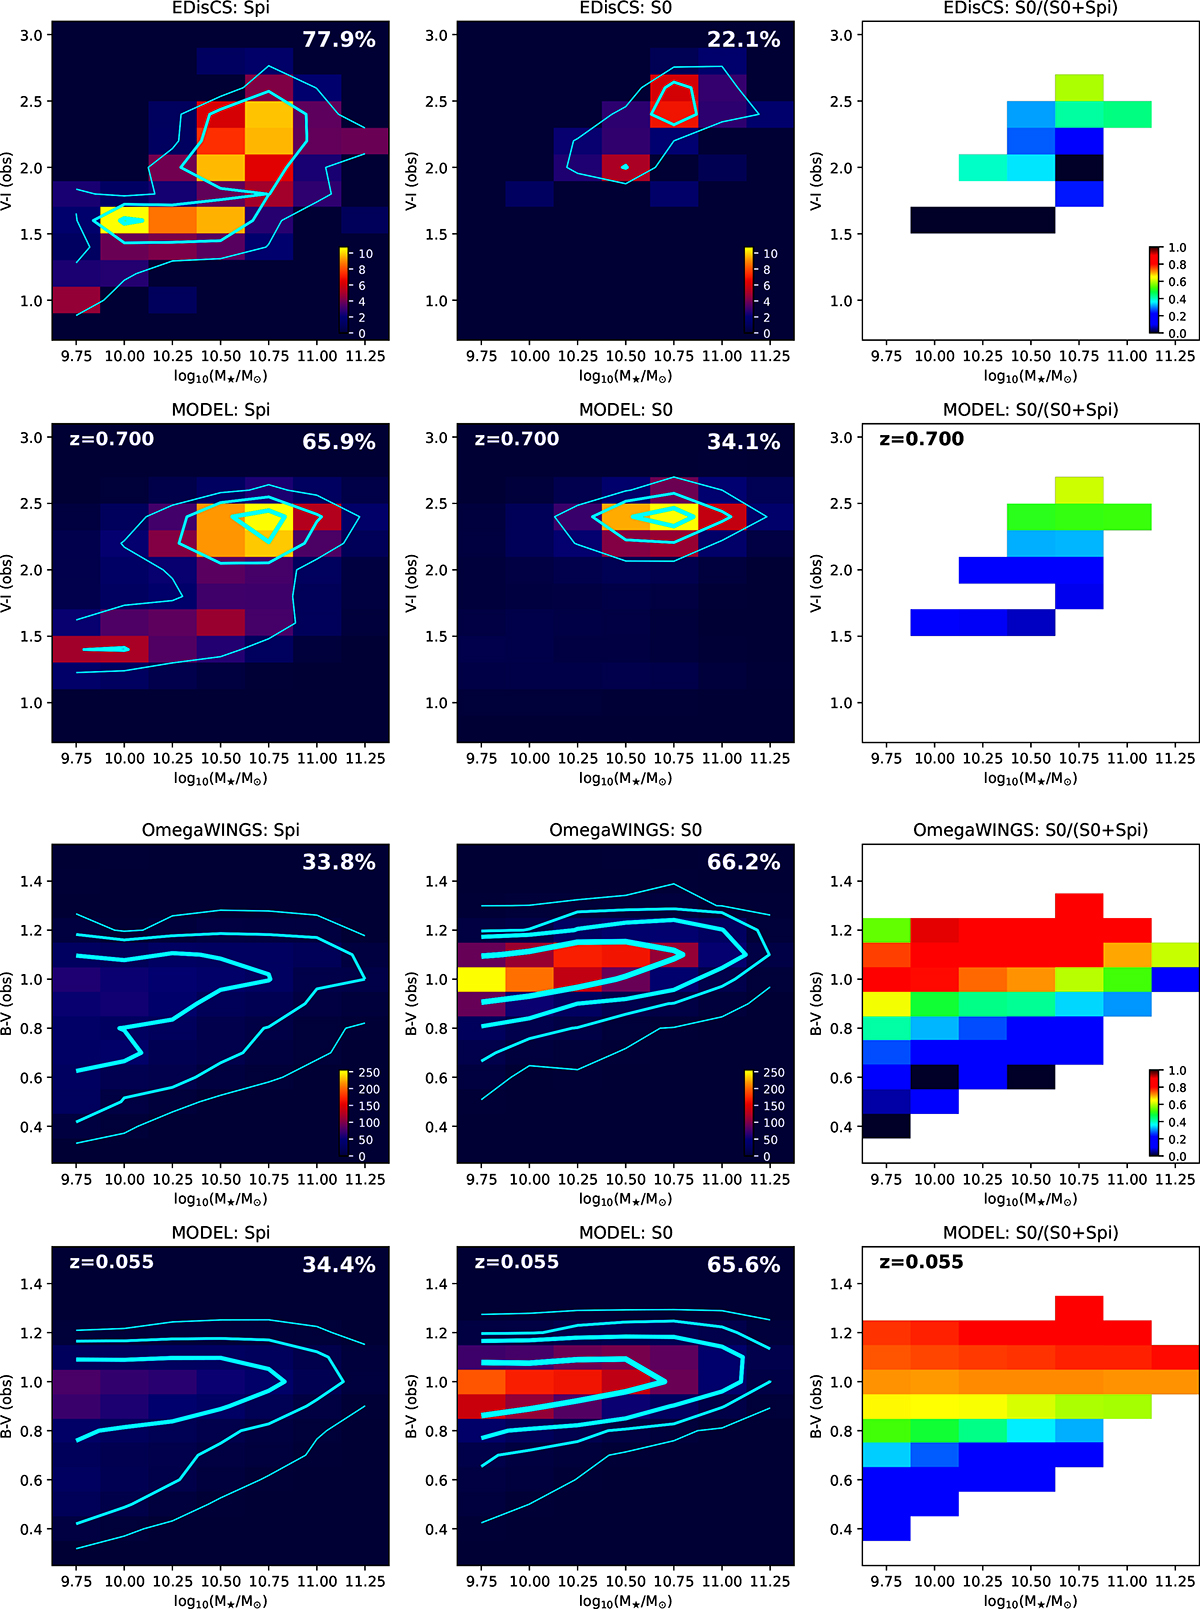
Fig. 4.
Download original image
Comparison of our best-fit cluster model with the EDisCS data at z = 0.7 (top six panels), and with the OmegaWINGS data at z = 0.055 (bottom six panels). The data and the model are shown in the first and second row of each panel set, respectively. Panels in the leftmost (central) column show the distribution of spirals (S0s) in a colour-M★ plane, where the colour is the observed-frame (V − I) for EDisCS and the (B − V) for OmegaWINGS. The colour palette indicate the number of galaxies per bin. Cyan contours are drawn at 2, 5, 10, and 15 galaxies per bin in EDisCS and in the model at z = 0.7, and at 2, 10, 30, and 100 galaxies per bin in OmegaWINGS and in the model at z = 0.055. The total fraction of Spi and S0 galaxies with respect to the total disc (Spi+S0) population is indicated in the top-right corner of each panel. Panels in the rightmost column show the S0 fraction as a function of colour and M★, for bins that have at least five galaxies in the data.
Current usage metrics show cumulative count of Article Views (full-text article views including HTML views, PDF and ePub downloads, according to the available data) and Abstracts Views on Vision4Press platform.
Data correspond to usage on the plateform after 2015. The current usage metrics is available 48-96 hours after online publication and is updated daily on week days.
Initial download of the metrics may take a while.