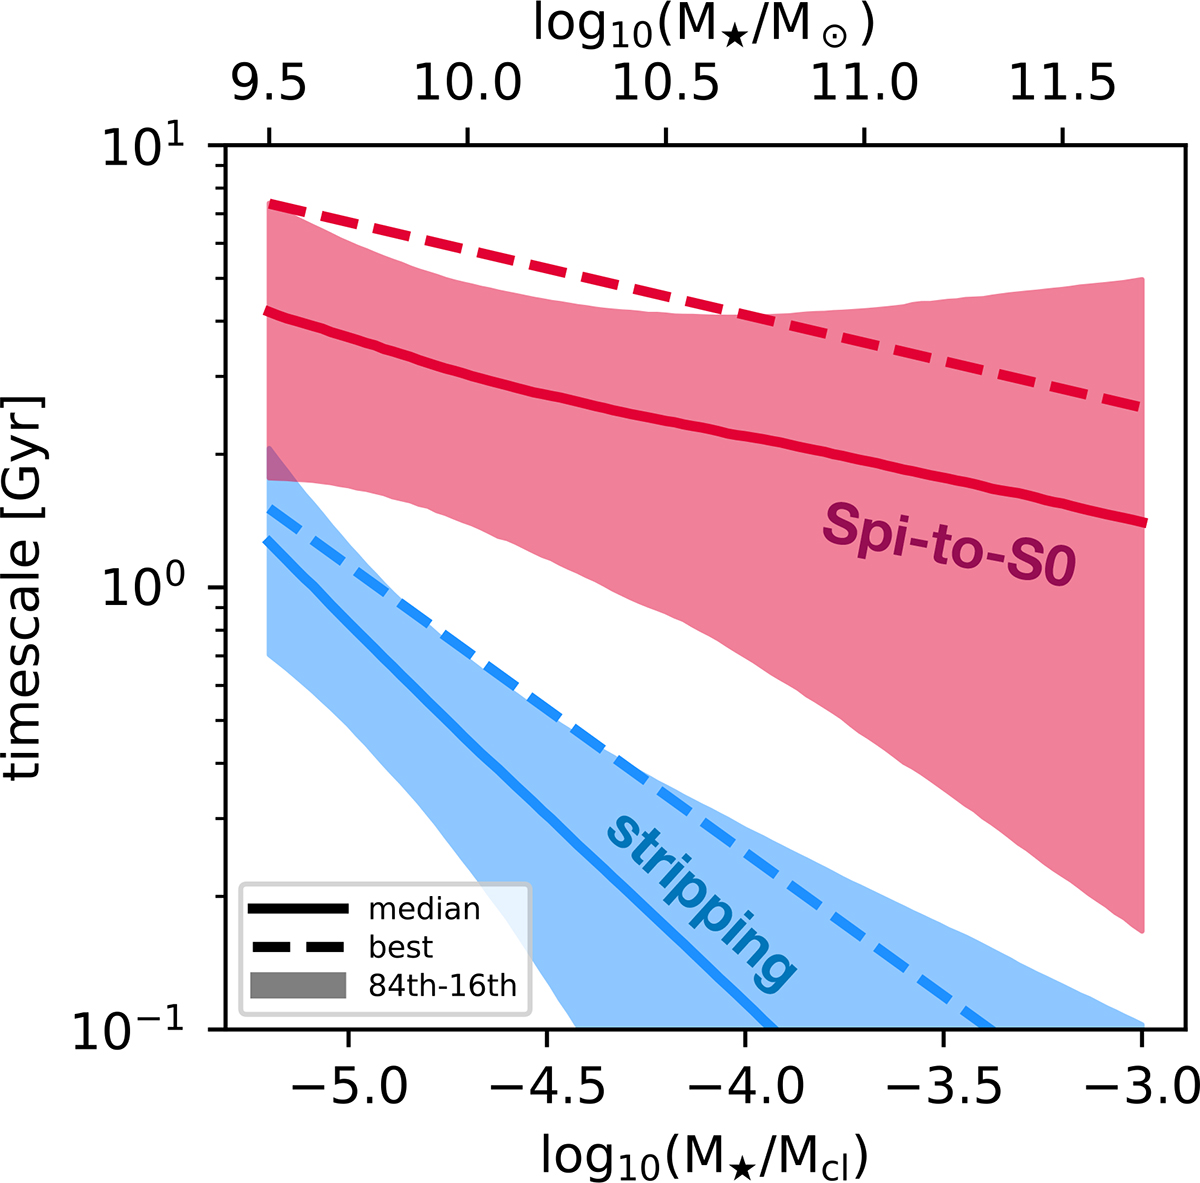
Fig. 5.
Download original image
Characteristic timescales for the ram-pressure stripping (blue) and for the cluster-driven morphological transformation (red) as a function of the galaxy-to-cluster mass ratio (M★/Mcl) derived with our analysis (Equations 3 and 5). The solid lines show the median trend, with the shaded regions showing the difference between the 16th and 84th percentiles. The dashed lines show the best-fit model. As a reference, in the horizontal axis on top we report the M★ scale for a fixed log10(Mcl/ M⊙) = 14.7.
Current usage metrics show cumulative count of Article Views (full-text article views including HTML views, PDF and ePub downloads, according to the available data) and Abstracts Views on Vision4Press platform.
Data correspond to usage on the plateform after 2015. The current usage metrics is available 48-96 hours after online publication and is updated daily on week days.
Initial download of the metrics may take a while.