Fig. 6.
Download original image
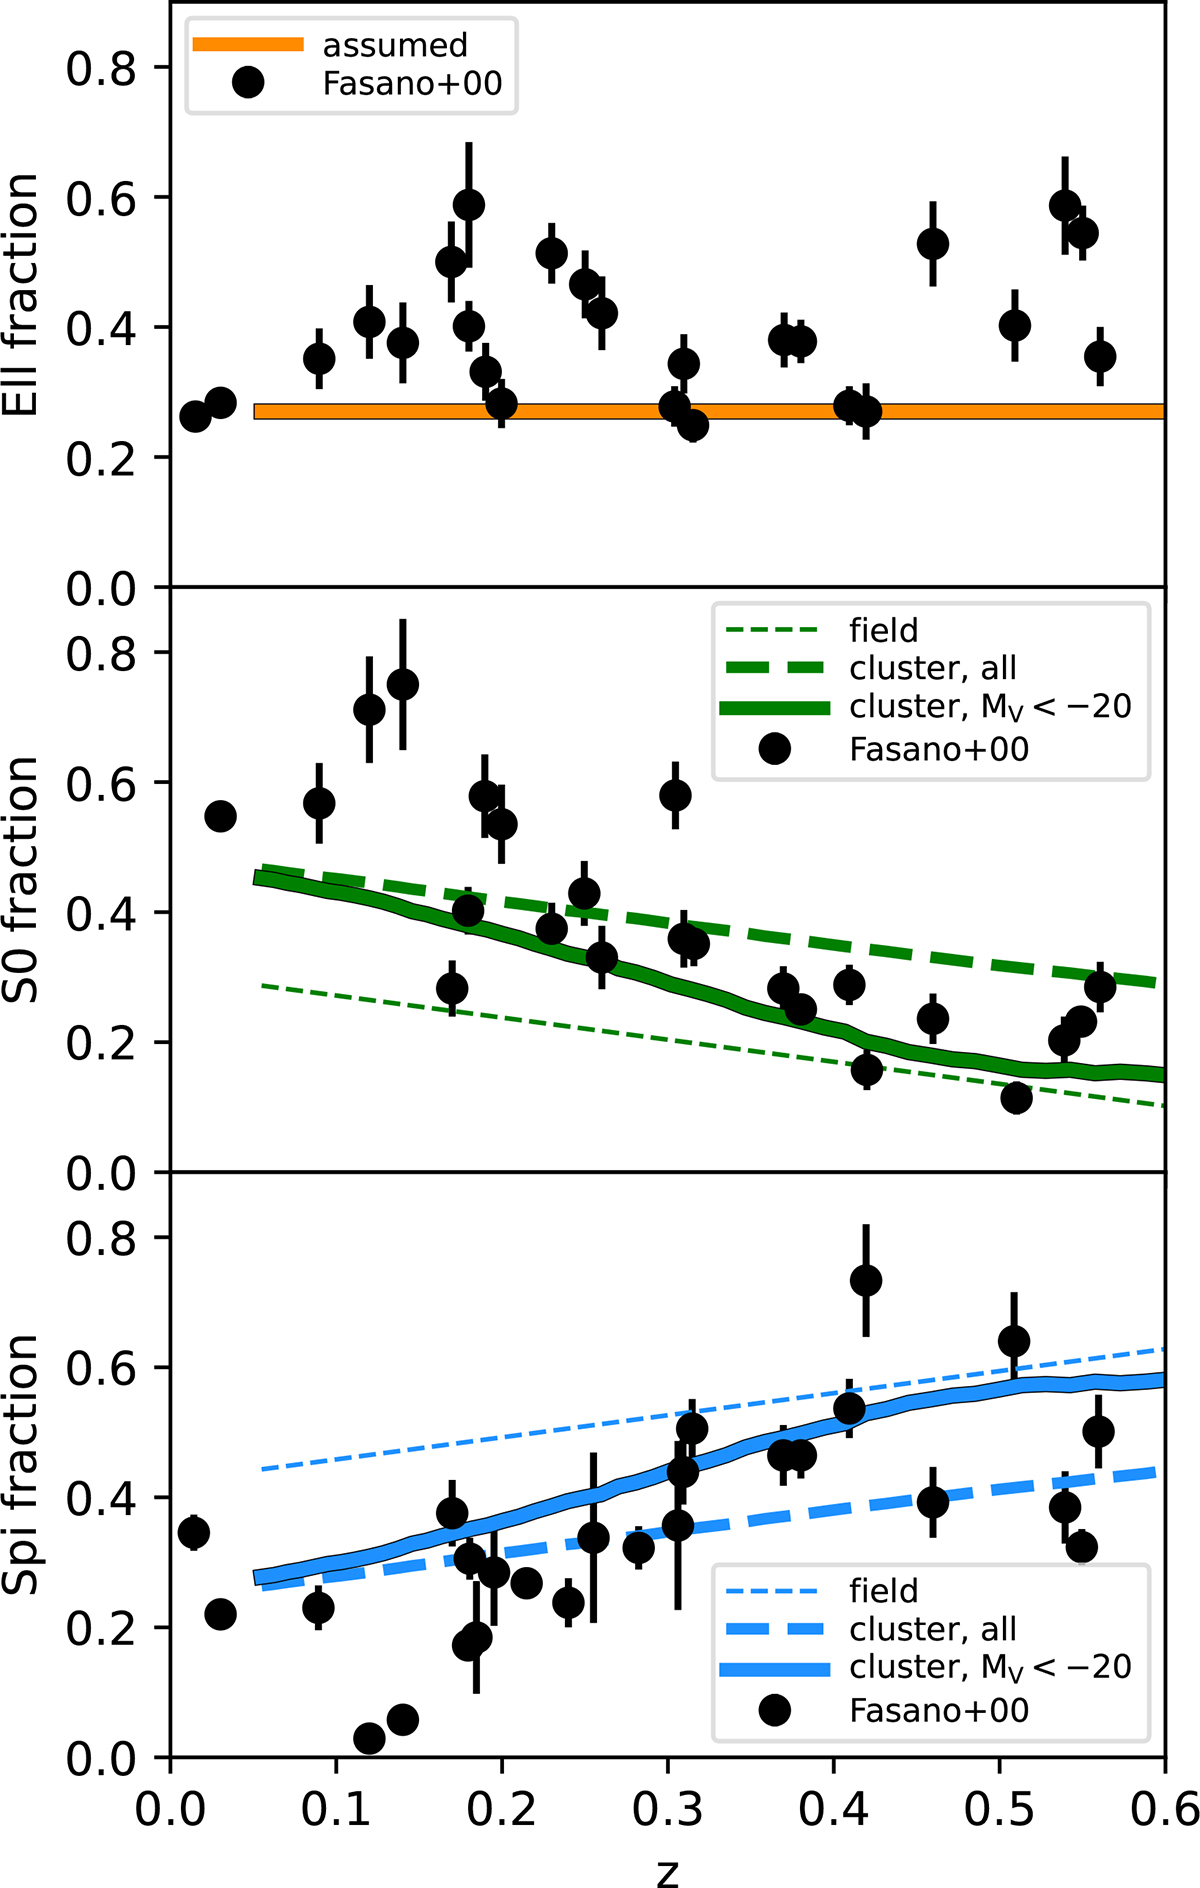
Evolution of the morphological fraction of cluster galaxies for z < 0.6. The black circles with error-bars show the measurements of Fasano et al. (2000), complete down to MV < −20. The thick solid curves show the predictions from our best-fit model using the same photometric completeness, while the thick dashed curves show the predictions using all galaxies available. The thin dashed curves show the assumed field fractions. As discussed in Section 2.2.2, the Ell fraction in the model is set to a constant 27% by construction.
Current usage metrics show cumulative count of Article Views (full-text article views including HTML views, PDF and ePub downloads, according to the available data) and Abstracts Views on Vision4Press platform.
Data correspond to usage on the plateform after 2015. The current usage metrics is available 48-96 hours after online publication and is updated daily on week days.
Initial download of the metrics may take a while.