Fig. 7.
Download original image
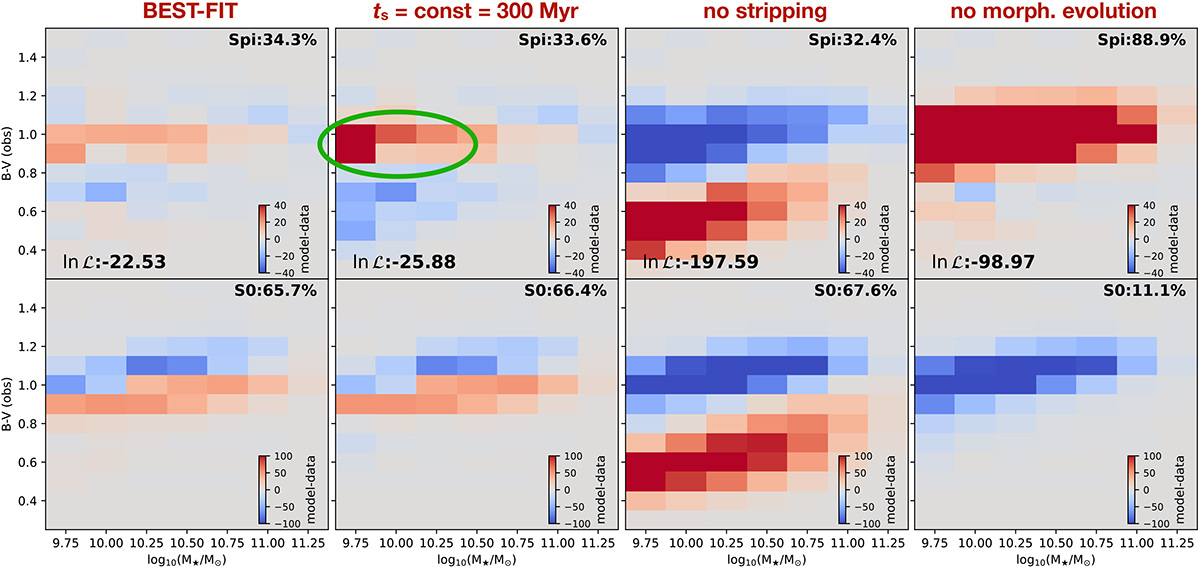
Comparison between the residuals (model-data) in the (B − V)-M★ plane of four different models: our best-fit model (first column), a model with constant ts of 300 Myr (second column), a model without RPS from the ICM (third column), and a model without morphological evolution (fourth column). Red (blue) colours indicate an excess (a deficiency) of galaxies in the model compared to the data. The top and bottom rows show the Spi and S0 populations, respectively. The green ellipse highlights the excess of low-mass red spirals in the model with constant ts. For each model we also list the value of the log likelihood (Equation (6)). For brevity, we only show the results at the redshift of the OmegaWINGS clusters.
Current usage metrics show cumulative count of Article Views (full-text article views including HTML views, PDF and ePub downloads, according to the available data) and Abstracts Views on Vision4Press platform.
Data correspond to usage on the plateform after 2015. The current usage metrics is available 48-96 hours after online publication and is updated daily on week days.
Initial download of the metrics may take a while.