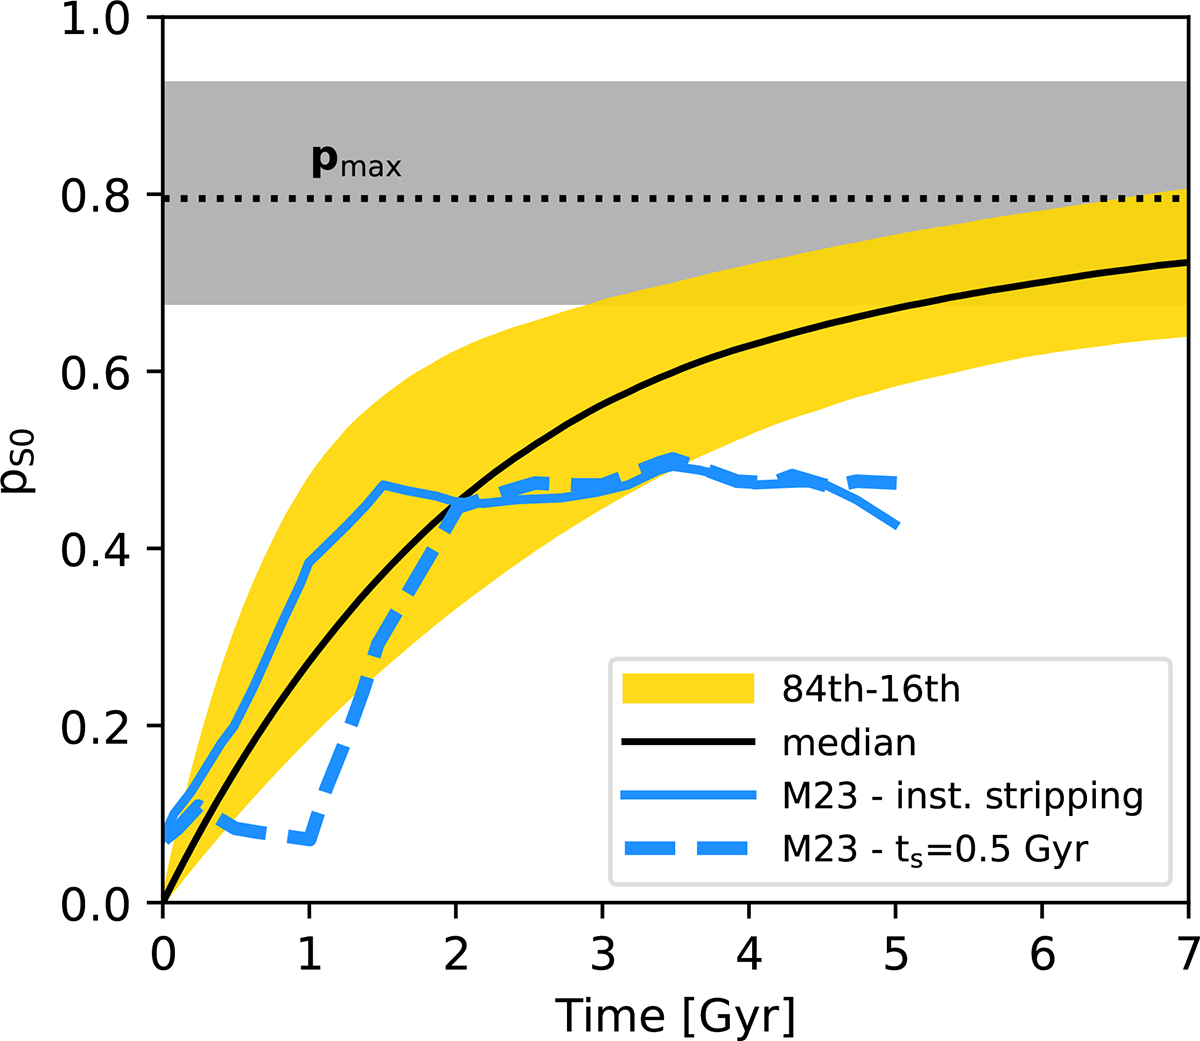
Fig. 8.
Download original image
Spiral-to-S0 transformation probability as a function of the time from the galaxy’s entry into the cluster. The blue curves show the results of M23 for the spectrophotometric evolution of a sample of 15 field galaxies with typical log10(M★/M⊙)≃10.5, assuming either instantaneous stripping (solid) or ts = 0.5 Gyr (dashed). The solid black curve shows our fiducial model for log10(M★/M⊙) = 10.5 and log10(Mcl/M⊙) = 14.7, with yellow shaded region showing its scatter given by the difference between the 84th and 16th percentiles. The dotted horizontal line with the grey band on top shows our fiducial pmax and its scatter.
Current usage metrics show cumulative count of Article Views (full-text article views including HTML views, PDF and ePub downloads, according to the available data) and Abstracts Views on Vision4Press platform.
Data correspond to usage on the plateform after 2015. The current usage metrics is available 48-96 hours after online publication and is updated daily on week days.
Initial download of the metrics may take a while.