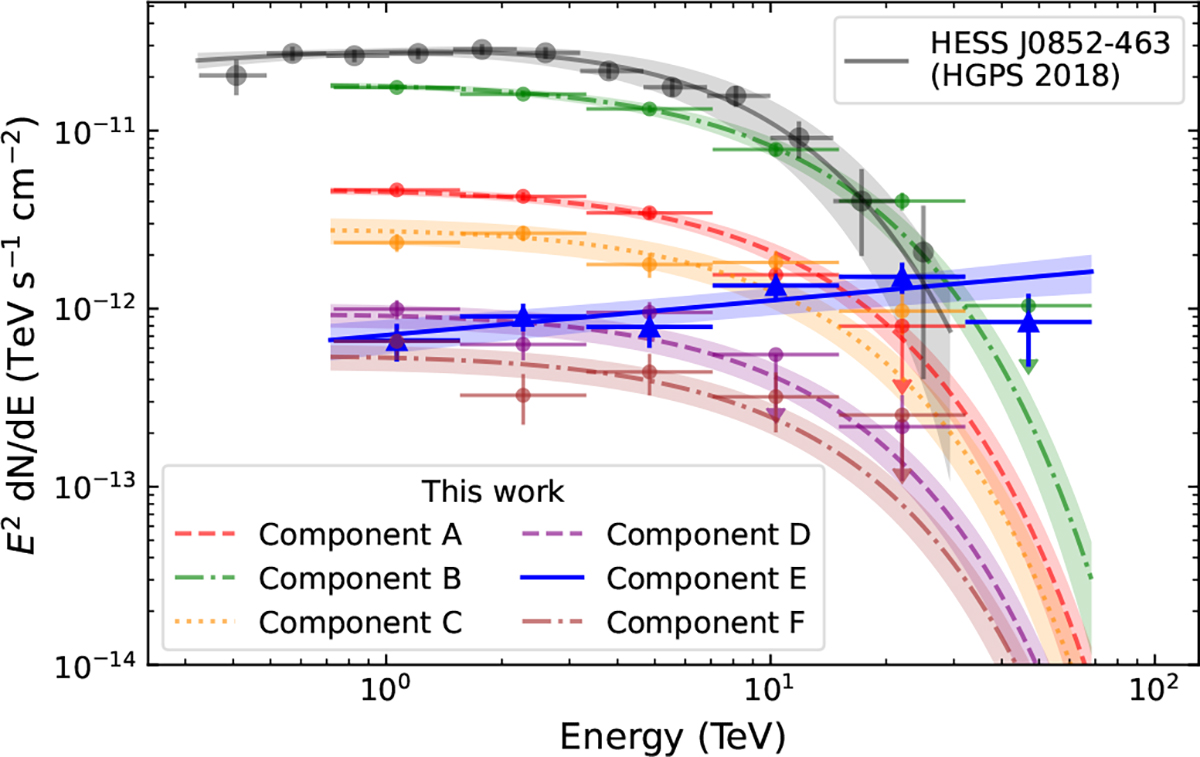
Fig. 3.
Download original image
Spectral energy distribution for each H.E.S.S. component. The components from this work (‘A’ to ‘F’) are shown in red (dashed), green (dot-dashed), orange (dotted), purple (dashed), blue (solid), and maroon (dot-dashed), respectively. The flux points are derived from the respective models. These spectra are compared to the HESS J0852−463 result in solid black from H.E.S.S. Collaboration (2018c).
Current usage metrics show cumulative count of Article Views (full-text article views including HTML views, PDF and ePub downloads, according to the available data) and Abstracts Views on Vision4Press platform.
Data correspond to usage on the plateform after 2015. The current usage metrics is available 48-96 hours after online publication and is updated daily on week days.
Initial download of the metrics may take a while.