Fig. 5.
Download original image
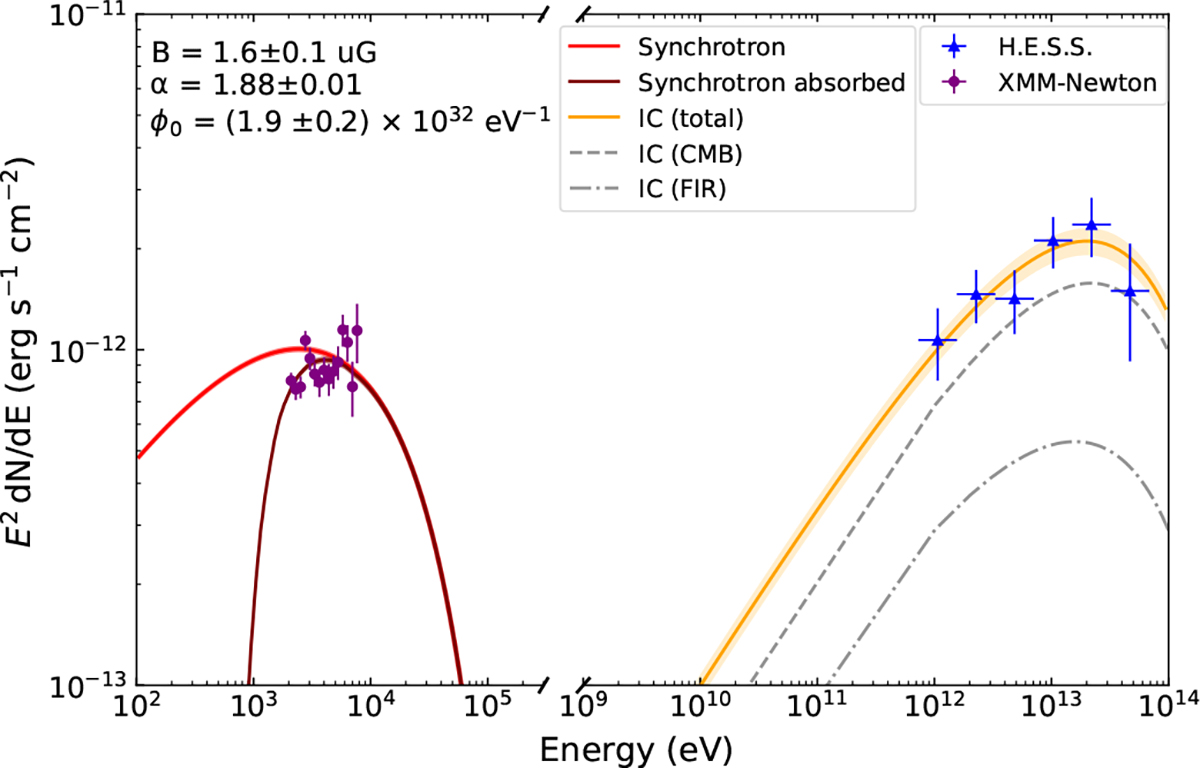
Broadband spectral energy distribution of component E in a simple one-zone leptonic scenario. The IC emission is shown for the CMB (grey-dashed line) and FIR (dot-dashed line) components. The total IC emission is indicated by the orange line. The NIR cannot be seen on this plot as it is a subdominant component. The red and maroon lines represent the synchrotron emission and synchrotron emission with absorption, respectively. An X-ray absorption column density of NH = 7.6 × 1021 cm−2 is assumed for this model. The XMM-Newton X-ray flux points are shown by the dark-purple-filled squares, and the TeV γ-ray flux points from component E are indicated by the blue-filled triangles. Both sets of flux points were calculated from the one-zone single model.
Current usage metrics show cumulative count of Article Views (full-text article views including HTML views, PDF and ePub downloads, according to the available data) and Abstracts Views on Vision4Press platform.
Data correspond to usage on the plateform after 2015. The current usage metrics is available 48-96 hours after online publication and is updated daily on week days.
Initial download of the metrics may take a while.