Fig. 1.
Download original image
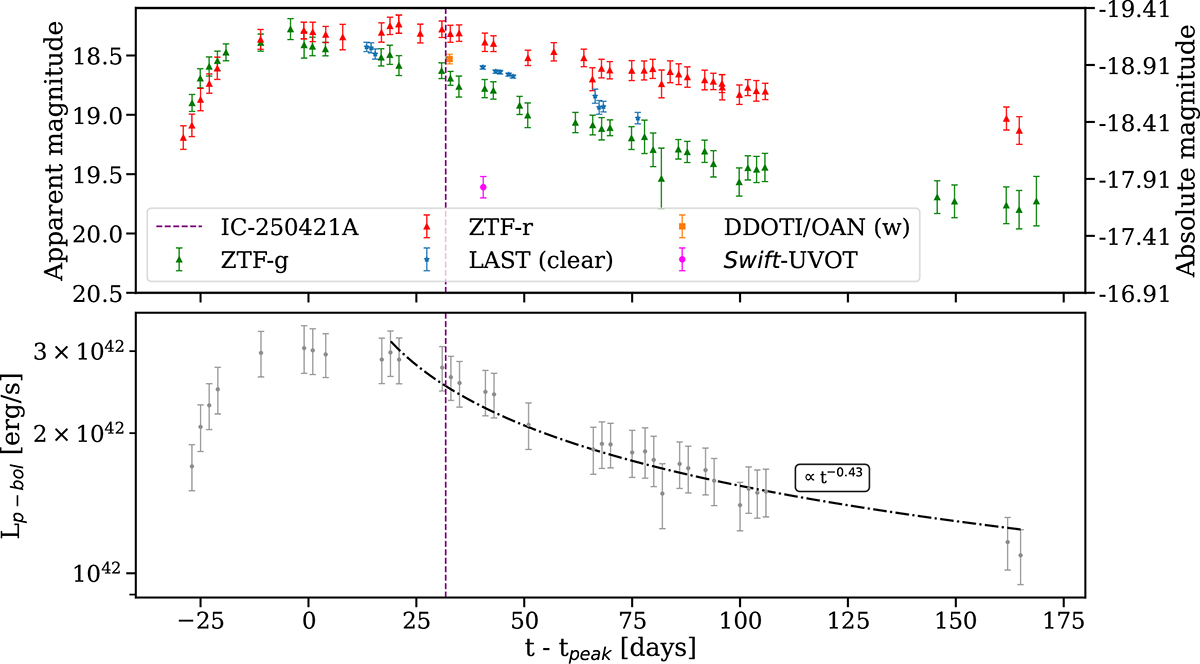
Upper: Photometric light curves from LAST (blue), ZTF-g (green), ZTF-r (red), DDOTI/OAN (orange) with temporal x-axis centered on the fitted peak time at MJD 60754.5. The magenta marker is the Swift-UVOT measurement in the UVW1 band. The dashed purple vertical line marks the arrival of IceCube-250421A. Lower: Pseudo-bolometric light curve in the (4700–6231 Å) range. The dot-dashed line shows the power-law fit of the early light curve decay after the peak (∝tα, α = −0.43).
Current usage metrics show cumulative count of Article Views (full-text article views including HTML views, PDF and ePub downloads, according to the available data) and Abstracts Views on Vision4Press platform.
Data correspond to usage on the plateform after 2015. The current usage metrics is available 48-96 hours after online publication and is updated daily on week days.
Initial download of the metrics may take a while.