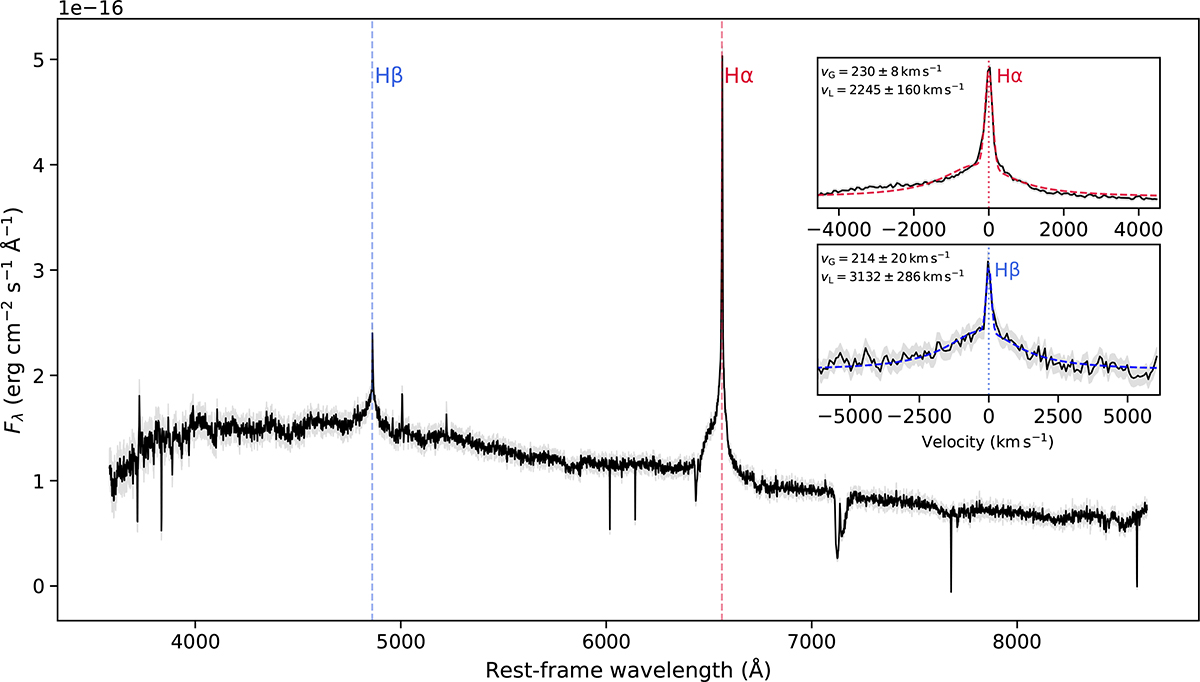
Fig. 3.
Download original image
MMT spectrum of SN2025cbj ∼56 days after the SN peak brightness. Zero velocity Hα and Hβ are marked with red and blue striped vertical lines, respectively. Zoom-ins on the Hα and β profiles with fits to a Lorentzian plus Gaussian shape are added, showing a good fit aside from the blue-wing asymmetry in Hα. The best-fit velocities (i.e., line FWHM) for both the Gaussian, vG, and Lorentzian, vL, components are presented next to the fits.
Current usage metrics show cumulative count of Article Views (full-text article views including HTML views, PDF and ePub downloads, according to the available data) and Abstracts Views on Vision4Press platform.
Data correspond to usage on the plateform after 2015. The current usage metrics is available 48-96 hours after online publication and is updated daily on week days.
Initial download of the metrics may take a while.