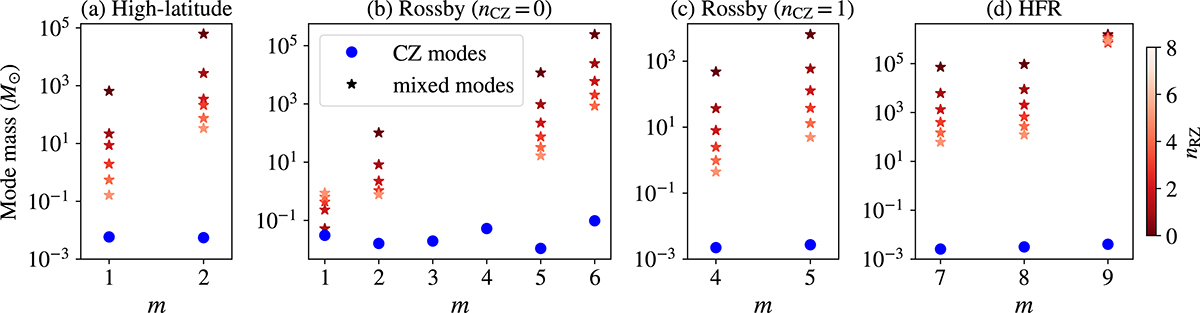
Fig. D.1.
Download original image
Mode mass (Eq. D.1) of the mixed modes (red stars) and of their nearest inertial modes with motions predominantly in the CZ (blue dots). The 11 mixed modes marked in Fig. 8 are shown. The colour of the star symbols denotes the number of radial nodes (nRZ) in the region 0.5 R⊙ ≤ r ≤ 0.71 R⊙. For simplicity, we show only the mixed modes with nRZ ≤ 5.
Current usage metrics show cumulative count of Article Views (full-text article views including HTML views, PDF and ePub downloads, according to the available data) and Abstracts Views on Vision4Press platform.
Data correspond to usage on the plateform after 2015. The current usage metrics is available 48-96 hours after online publication and is updated daily on week days.
Initial download of the metrics may take a while.