Fig. 2.
Download original image
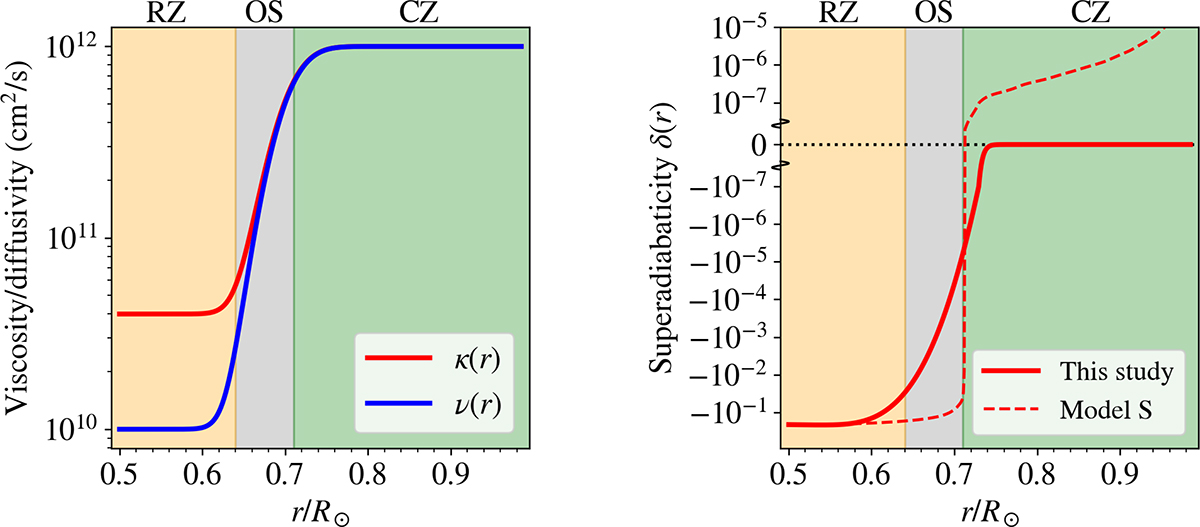
Left: Profiles of turbulent viscosity, ν(r), and turbulent thermal diffusivity, κ(r), as functions of radius. They are expressed by Eqs. (8) and (9). Right: Profile of super-adiabaticity, δ(r), as a function of radius (Eq. 10). The super-adiabaticity profile from the standard Model S is represented by the dashed red curve (Christensen-Dalsgaard et al. 1996). The y-axis is linear for |δ|< 10−7 and logarithmic beyond that. In both panels, the green-shaded area denotes the CZ, the grey-shaded region the OS, and the orange-shaded region the RZ.
Current usage metrics show cumulative count of Article Views (full-text article views including HTML views, PDF and ePub downloads, according to the available data) and Abstracts Views on Vision4Press platform.
Data correspond to usage on the plateform after 2015. The current usage metrics is available 48-96 hours after online publication and is updated daily on week days.
Initial download of the metrics may take a while.