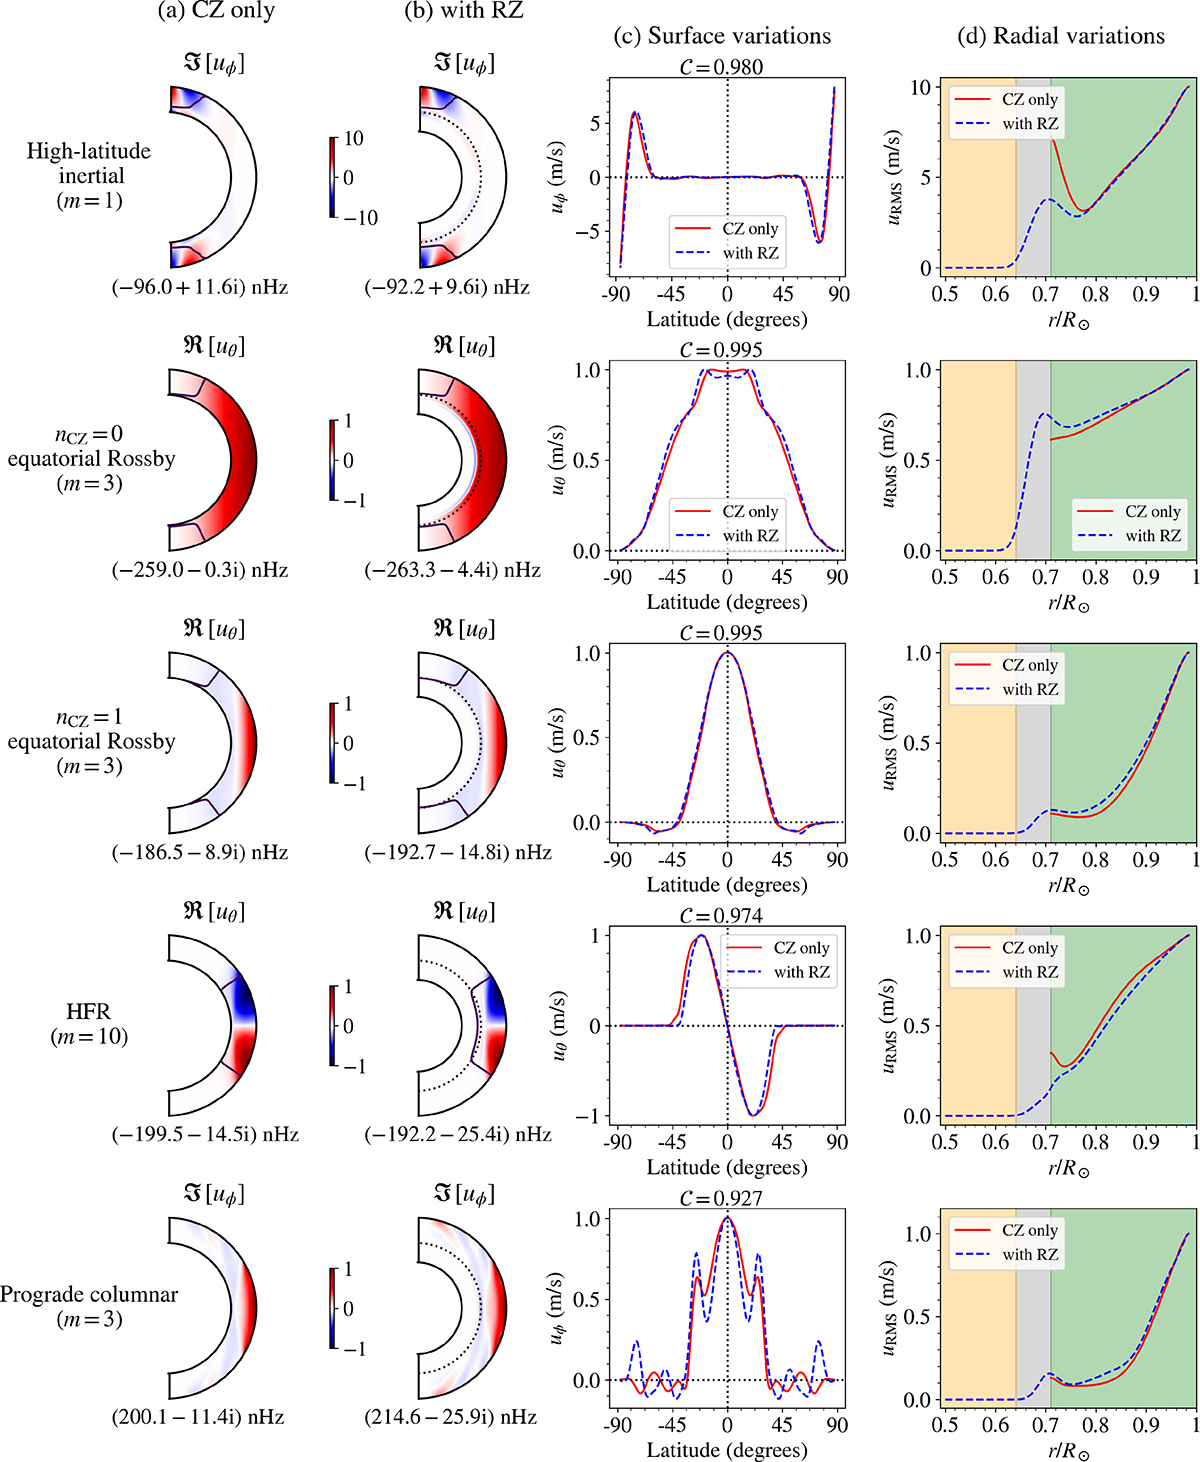
Fig. 3.
Download original image
Comparison of selected inertial modes computed in the setups that include or exclude the RZ. (a) Velocity eigenfunctions in meridional cross-sections from the CZ-only model. The real part of the eigenfunction corresponds to a longitude ϕ0 (where uθ is maximum), while the imaginary part corresponds to the longitude ϕ0 − π/2m. The m = 1 high-latitude mode is normalized to have the maximum surface velocity of 10 m s−1, while the other modes are normalized to have a maximum surface velocity of 1 m s−1. Solid black curves denote the critical layers of the mode where ℜ[ω]=m(Ω − Ω0). The frequencies are measured in the Carrington frame. (b) Same as panel a but from the extended model that includes the RZ. Dotted black lines denote the base of the CZ. (c) Horizontal velocity eigenfunctions as functions of latitude at the surface. Dashed blue and solid red curves represent the results with and without the RZ, respectively. The correlation coefficient between the eigenfunctions, 𝒞, defined in Eq. (13), is noted above each subplot. (d) Radial profiles of the RMS velocity.
Current usage metrics show cumulative count of Article Views (full-text article views including HTML views, PDF and ePub downloads, according to the available data) and Abstracts Views on Vision4Press platform.
Data correspond to usage on the plateform after 2015. The current usage metrics is available 48-96 hours after online publication and is updated daily on week days.
Initial download of the metrics may take a while.