Fig. 5.
Download original image
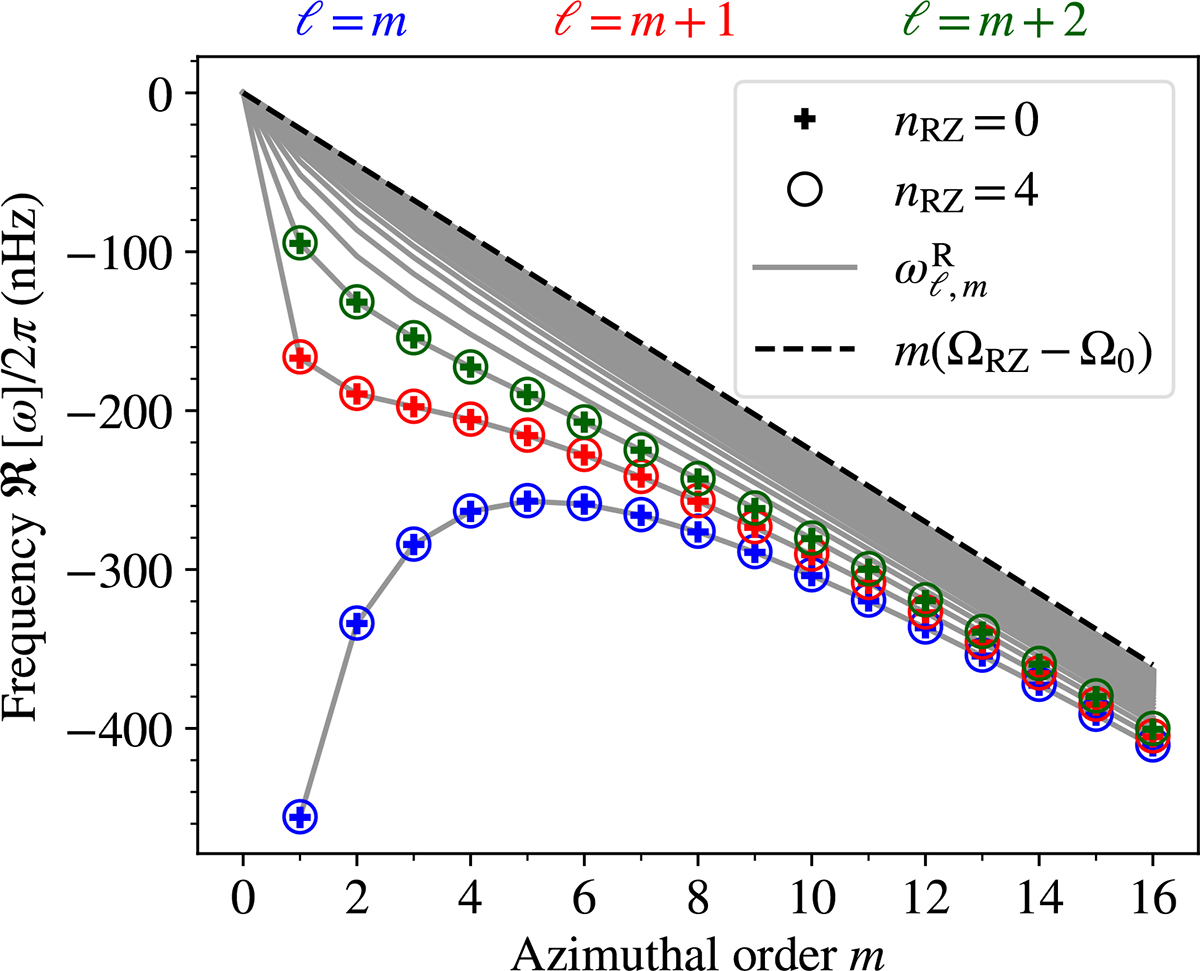
Dispersion relations of the Rossby modes inside the RZ with ℓ = m (navy blue), ℓ = m + 1 (red), and ℓ = m + 2 (dark green) for azimuthal orders 1 ≤ m ≤ 16. The frequencies are measured in the Carrington frame. Plus symbols (nRZ = 0) and open circles (nRZ = 4) denote modes with different numbers of radial nodes, nRZ, in the region 0.5 R⊙ ≤ r ≤ 0.71 R⊙. Solid grey curves represent the theoretical dispersion relations of the classical Rossby modes ![]() given by Eq. (14). The dashed black line denotes the maximum possible value of
given by Eq. (14). The dashed black line denotes the maximum possible value of ![]() .
.
Current usage metrics show cumulative count of Article Views (full-text article views including HTML views, PDF and ePub downloads, according to the available data) and Abstracts Views on Vision4Press platform.
Data correspond to usage on the plateform after 2015. The current usage metrics is available 48-96 hours after online publication and is updated daily on week days.
Initial download of the metrics may take a while.