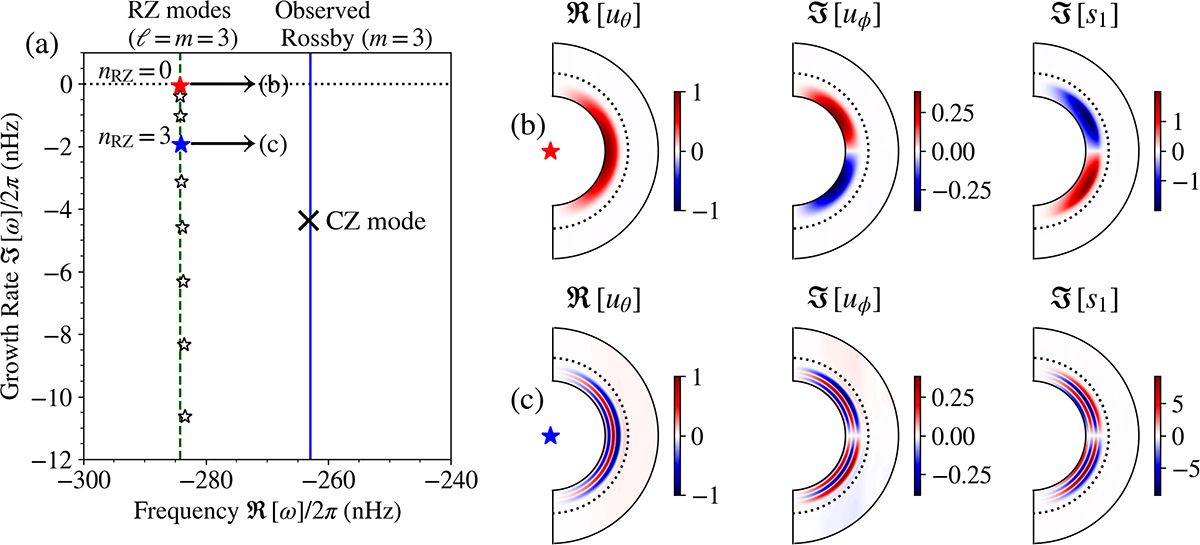
Fig. 6.
Download original image
Position of the RZ Rossby modes with ℓ = m = 3 in the complex frequency space and their eigenfunctions. (a) Complex frequency spectrum of equatorial Rossby modes in the RZ with azimuthal order m = 3. Star symbols denote the RZ Rossby modes, while the cross symbol denotes the CZ Rossby mode. The red (blue) star marks the RZ Rossby mode with the number of radial nodes, nRZ = 0 (nRZ = 3), in the region 0.5 R⊙ ≤ r ≤ 0.71 R⊙. The vertical solid blue line denotes the observed Rossby mode frequency, while the vertical dashed green line denotes the frequency given by Eq. (14). (b) Meridional eigenfunction of the RZ Rossby mode with nRZ = 0 (red star). The longitudes corresponding to the real and imaginary components are designated in the same way as in Fig. 3. Dotted lines denote the position of the base of the CZ. Eigenfunctions are normalized such that the maximum of uθ is 1 m s−1. The unit of s1 is erg g−1 K−1. (c) Same as b but for the RZ Rossby mode with nRZ = 3 (blue star).
Current usage metrics show cumulative count of Article Views (full-text article views including HTML views, PDF and ePub downloads, according to the available data) and Abstracts Views on Vision4Press platform.
Data correspond to usage on the plateform after 2015. The current usage metrics is available 48-96 hours after online publication and is updated daily on week days.
Initial download of the metrics may take a while.