Open Access
Fig. 5
Download original image
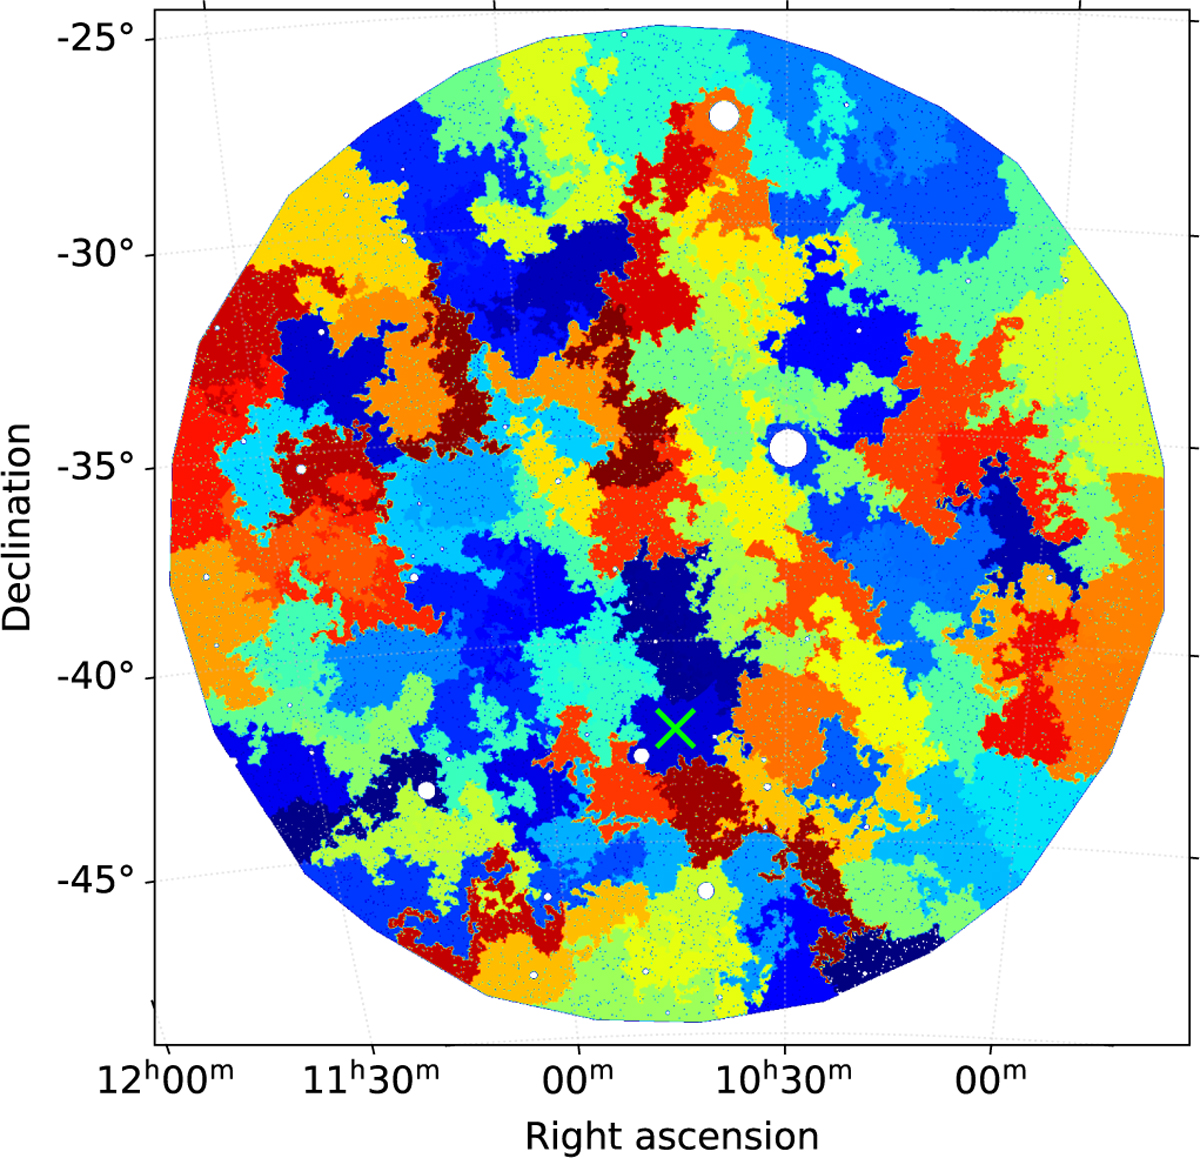
Contour-bin map where each distinct colour represents a contour-bin region, used for extracting individual spectra. The green × symbol marks the location of the associated bin in the example spectrum shown in Fig. 8.
Current usage metrics show cumulative count of Article Views (full-text article views including HTML views, PDF and ePub downloads, according to the available data) and Abstracts Views on Vision4Press platform.
Data correspond to usage on the plateform after 2015. The current usage metrics is available 48-96 hours after online publication and is updated daily on week days.
Initial download of the metrics may take a while.