Open Access
Fig. 6
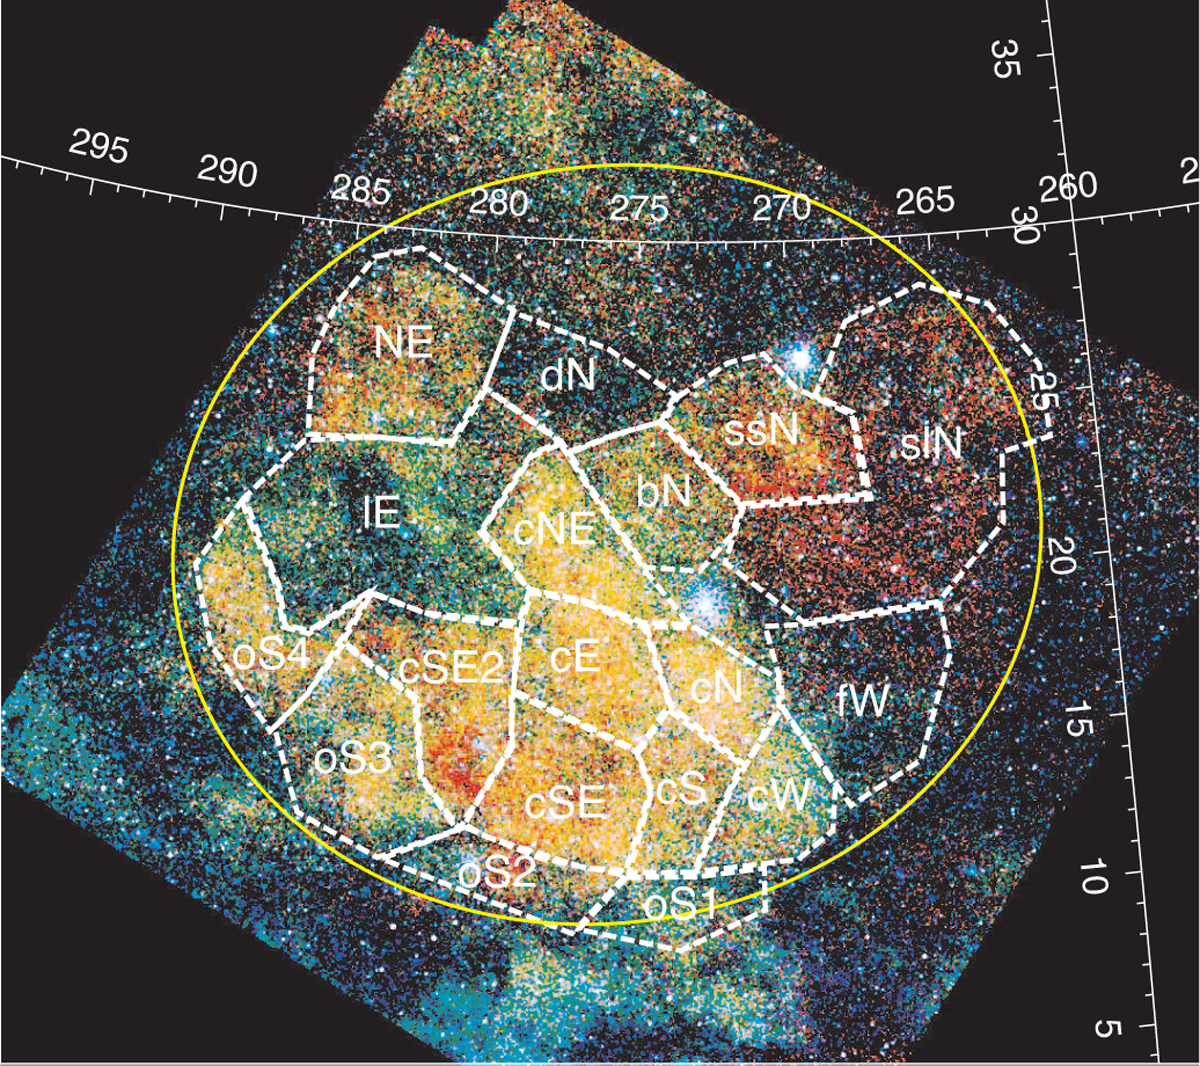
Download original image
Manually defined spectra extraction regions overlayed on the X-ray mosaic shown in Fig. 1. The labels are abbreviations for the region names given in Table 1. In addition, an ellipse region is shown that covers the entire SNR and is used for calculations of physical parameters of the SNR in Sect. 7.2.
Current usage metrics show cumulative count of Article Views (full-text article views including HTML views, PDF and ePub downloads, according to the available data) and Abstracts Views on Vision4Press platform.
Data correspond to usage on the plateform after 2015. The current usage metrics is available 48-96 hours after online publication and is updated daily on week days.
Initial download of the metrics may take a while.