Open Access
Fig. 9
Download original image
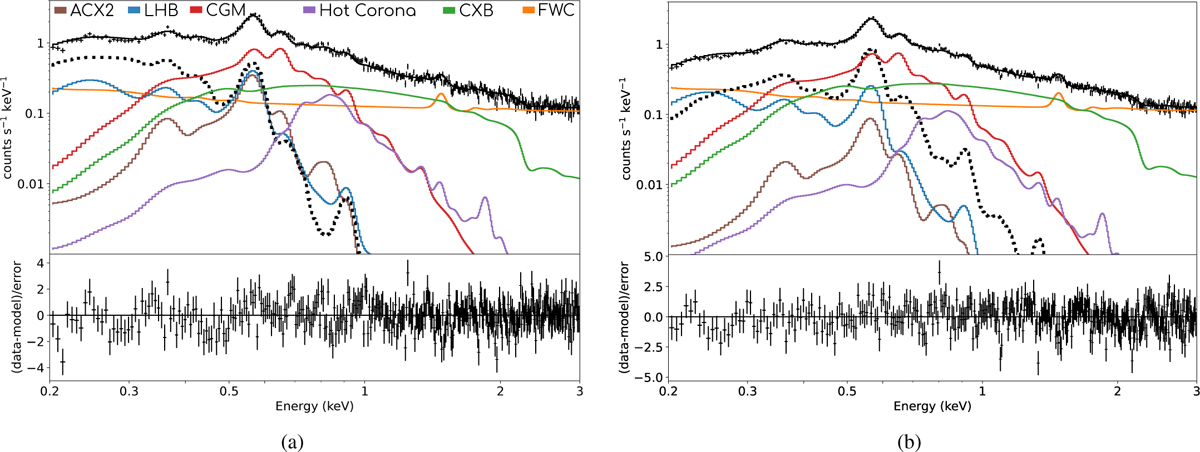
Example spectra of the (a) central_SE and (b) large_E regions. The lower panel shows the residuals. For visual purposes only, the spectra were binned with a minimum of 5σ or 50 counts per bin and for better visibility only the spectrum and model for TM1 is shown.
Current usage metrics show cumulative count of Article Views (full-text article views including HTML views, PDF and ePub downloads, according to the available data) and Abstracts Views on Vision4Press platform.
Data correspond to usage on the plateform after 2015. The current usage metrics is available 48-96 hours after online publication and is updated daily on week days.
Initial download of the metrics may take a while.