Fig. E.1
Download original image
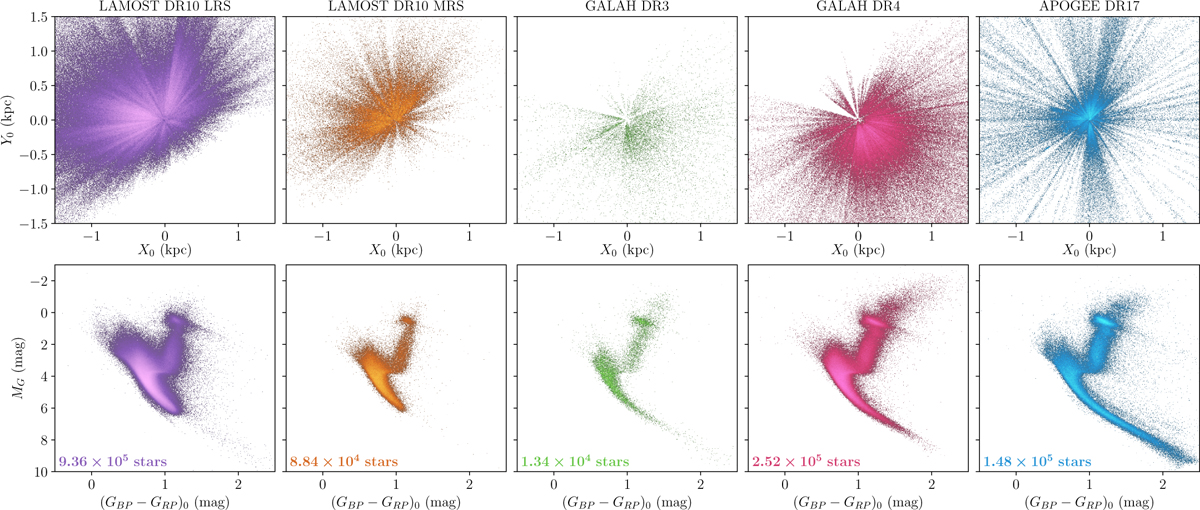
Overview of the surveys used in this work, coloured by density. From left to right: LAMOST DR10 (Cui et al. 2012; Zhao et al. 2012), LRS (purple) and MRS (orange), GALAH DR3 (De Silva et al. 2015; Buder et al. 2021) (green), GALAH DR4 (De Silva et al. 2015; Buder et al. 2025) (pink) and APOGEE DR17 (Abdurro’uf et al. 2022) (blue). Top panel: Face-on (X0,Y0) galactic maps, centred on the Sun. Bottom panel: Hertzsprung-Russell Diagrams, coloured by density. The number of stars in each sample is annotated in the bottom left panel corner. Lighter colours correspond to higher density regions.
Current usage metrics show cumulative count of Article Views (full-text article views including HTML views, PDF and ePub downloads, according to the available data) and Abstracts Views on Vision4Press platform.
Data correspond to usage on the plateform after 2015. The current usage metrics is available 48-96 hours after online publication and is updated daily on week days.
Initial download of the metrics may take a while.