Open Access
Fig. G.1
Download original image
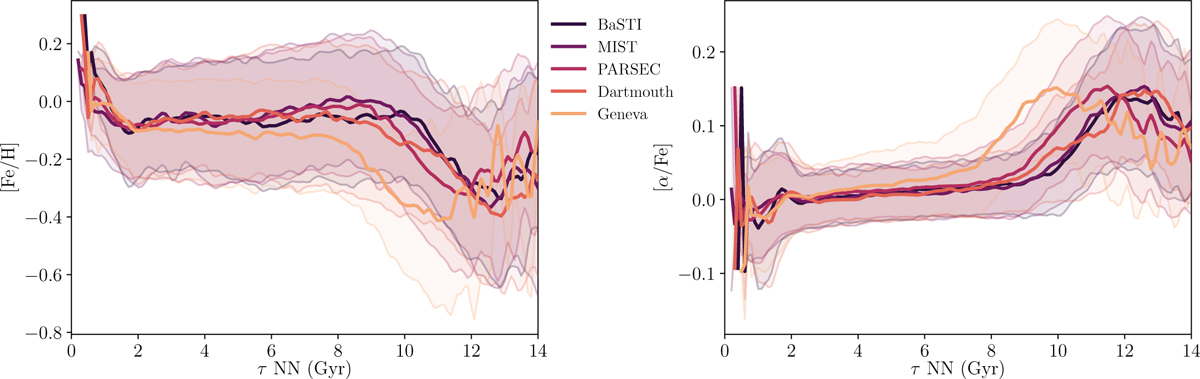
Abundance versus age trends for our APOGEE DR17 sample, with age estimated using NN trained on the BaSTI, MIST, PARSEC, Dartmouth, and Geneva grids. Coloured lines and shaded areas are the means and ±1σ of the distributions.
Current usage metrics show cumulative count of Article Views (full-text article views including HTML views, PDF and ePub downloads, according to the available data) and Abstracts Views on Vision4Press platform.
Data correspond to usage on the plateform after 2015. The current usage metrics is available 48-96 hours after online publication and is updated daily on week days.
Initial download of the metrics may take a while.