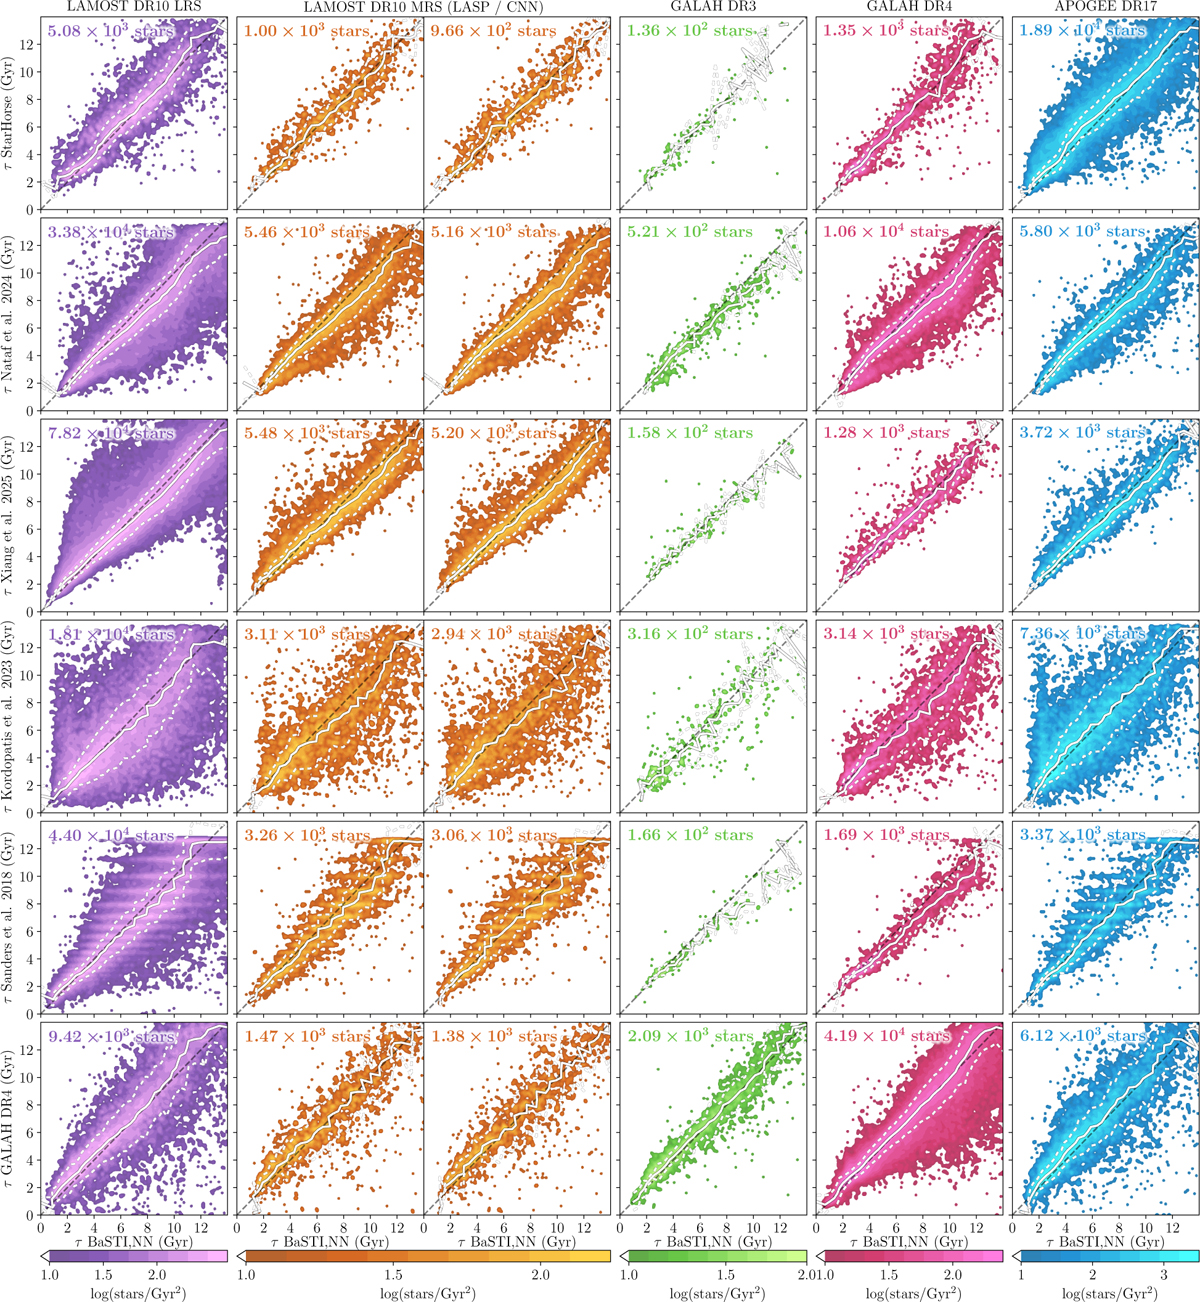
Fig. 3
Download original image
Age comparison of the ‘golden’ samples as defined in Section 4.2 used in this work with age estimates from the literature. From top to bottom: StarHorse (Queiroz et al. 2023), Nataf et al. (2024), Xiang et al. (2025), Kordopatis et al. (2023), and Sanders & Das (2018). The number of stars is shown in each panel in the top left corner, a one-to-one dashed line is provided to guide the eye. The running median and ±1σ are plotted in solid white and dashed lines, respectively.
Current usage metrics show cumulative count of Article Views (full-text article views including HTML views, PDF and ePub downloads, according to the available data) and Abstracts Views on Vision4Press platform.
Data correspond to usage on the plateform after 2015. The current usage metrics is available 48-96 hours after online publication and is updated daily on week days.
Initial download of the metrics may take a while.