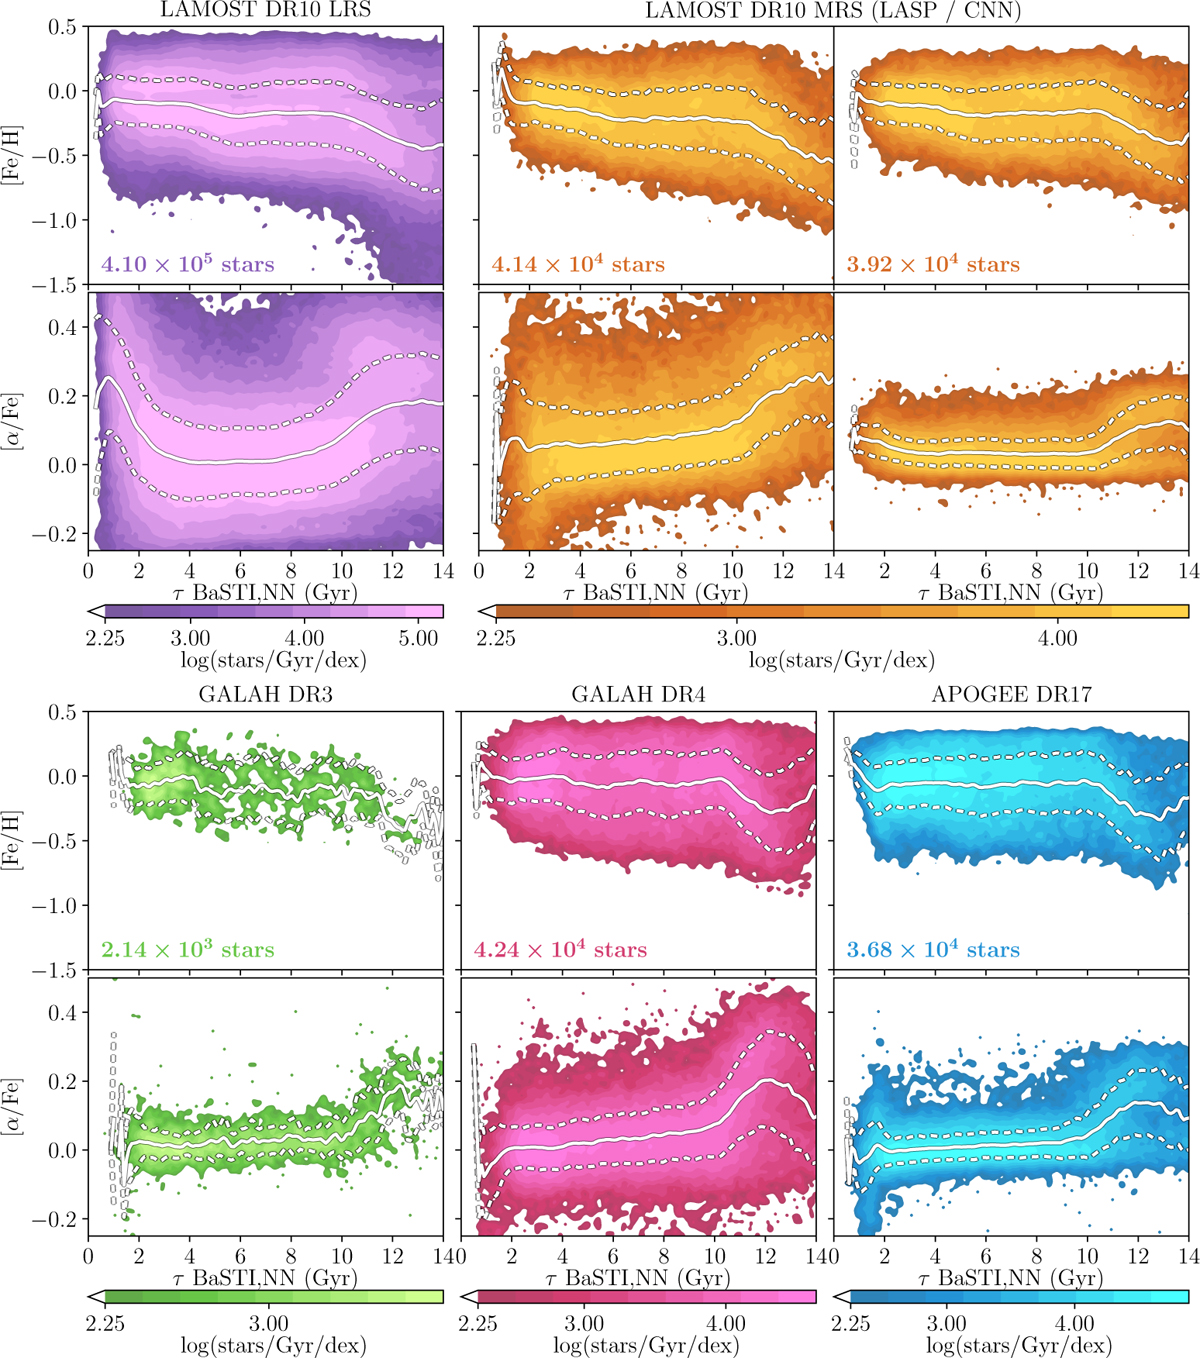
Fig. 4
Download original image
Abundance vs age planes for our samples, with ages estimated with the NN trained on the BaSTI grid. Odd rows: age vs [M/H]. Even rows: age vs [α/Fe]. The number of stars in each sample is annotated in the corners of the upper panels. The lighter colours correspond to higher density regions, and the means and ±1σ of the distributions are plotted as solid white and dashed lines, respectively.
Current usage metrics show cumulative count of Article Views (full-text article views including HTML views, PDF and ePub downloads, according to the available data) and Abstracts Views on Vision4Press platform.
Data correspond to usage on the plateform after 2015. The current usage metrics is available 48-96 hours after online publication and is updated daily on week days.
Initial download of the metrics may take a while.