Fig. 10
Download original image
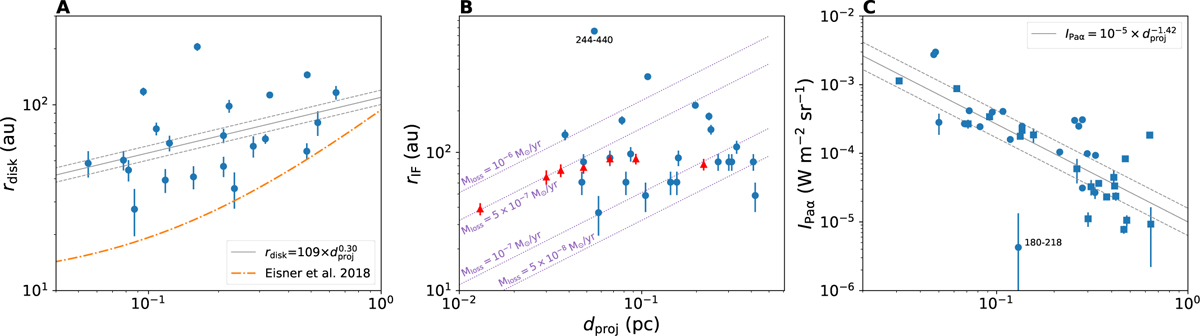
Disk radius (A), IF radius (B), and Pa α intensity (C) as a function of the projected distance (dproj) to the ionizing source. The solid black lines correspond to the linear regression. The dashed lines mark the regression at ± 1 σ. The dash-dotted line in panel A corresponds to the correlation obtained with ALMA observation at 850 μm by Eisner et al. (2018). The red triangles in panel B correspond to the IF radii measured by Aru et al. (2024). The purples lines are the expectation from the model of Johnstone et al. (1998) for given mass-loss rates.
Current usage metrics show cumulative count of Article Views (full-text article views including HTML views, PDF and ePub downloads, according to the available data) and Abstracts Views on Vision4Press platform.
Data correspond to usage on the plateform after 2015. The current usage metrics is available 48-96 hours after online publication and is updated daily on week days.
Initial download of the metrics may take a while.