Open Access
Fig. C.1
Download original image
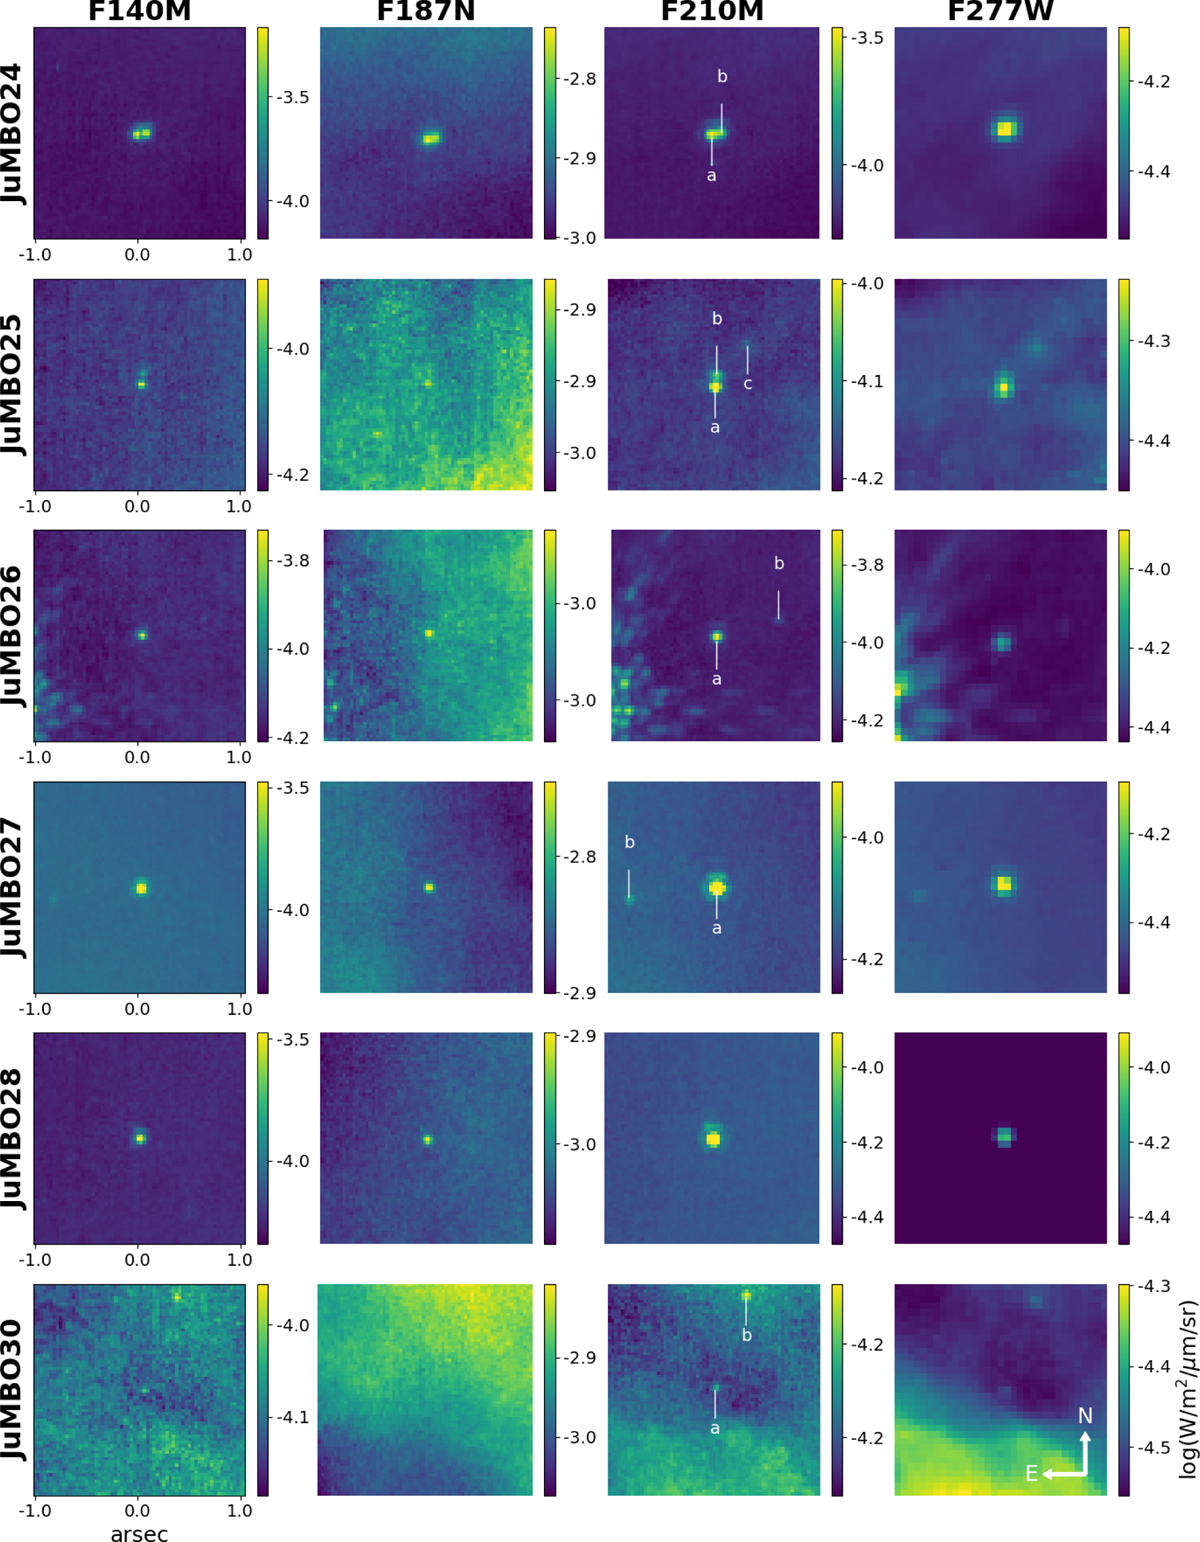
NIRCam images of six JuMBOs as seen in the PDRs4All program dataset. The components of each systems are labeled a, b, c in the F210M images when at leat two sources are detected. The colorbars are in ![]() .
.
Current usage metrics show cumulative count of Article Views (full-text article views including HTML views, PDF and ePub downloads, according to the available data) and Abstracts Views on Vision4Press platform.
Data correspond to usage on the plateform after 2015. The current usage metrics is available 48-96 hours after online publication and is updated daily on week days.
Initial download of the metrics may take a while.