Open Access
Fig. 1.
Download original image
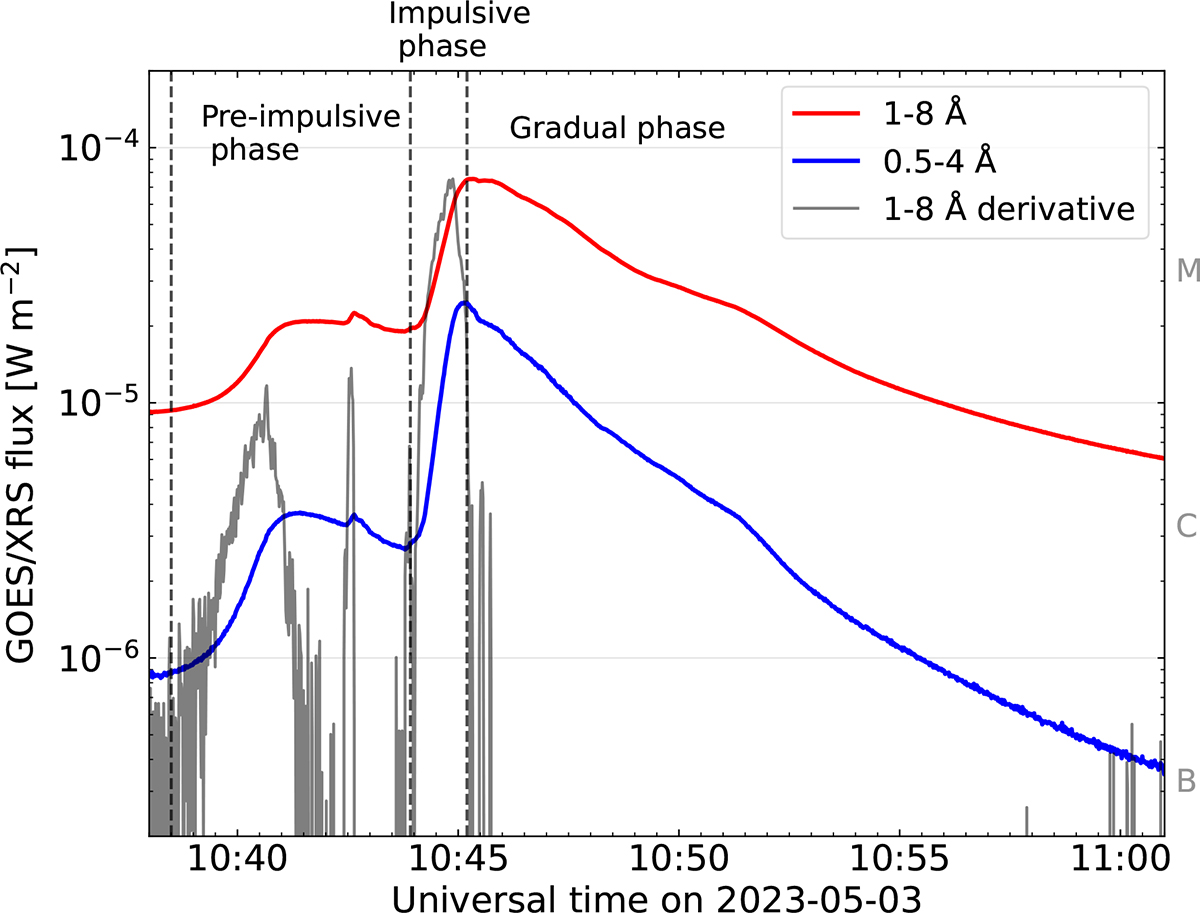
GOES/XRS time profiles for the 3 May 2023 M7 event. Vertical dashed lines separate the temporal phases of the solar flare. The blue curve corresponds to the 0.5−4 Å GOES channel, the red curve to the 1−8 Å channel, and the gray curve to the derivative of the 1−8 Å curve.
Current usage metrics show cumulative count of Article Views (full-text article views including HTML views, PDF and ePub downloads, according to the available data) and Abstracts Views on Vision4Press platform.
Data correspond to usage on the plateform after 2015. The current usage metrics is available 48-96 hours after online publication and is updated daily on week days.
Initial download of the metrics may take a while.